
September 2022 Phoenix Real Estate Snapshot
32% of New Home Sales Had Concessions to Buyers; Mortgage Rate Hikes Cause Drop in Contracts Again
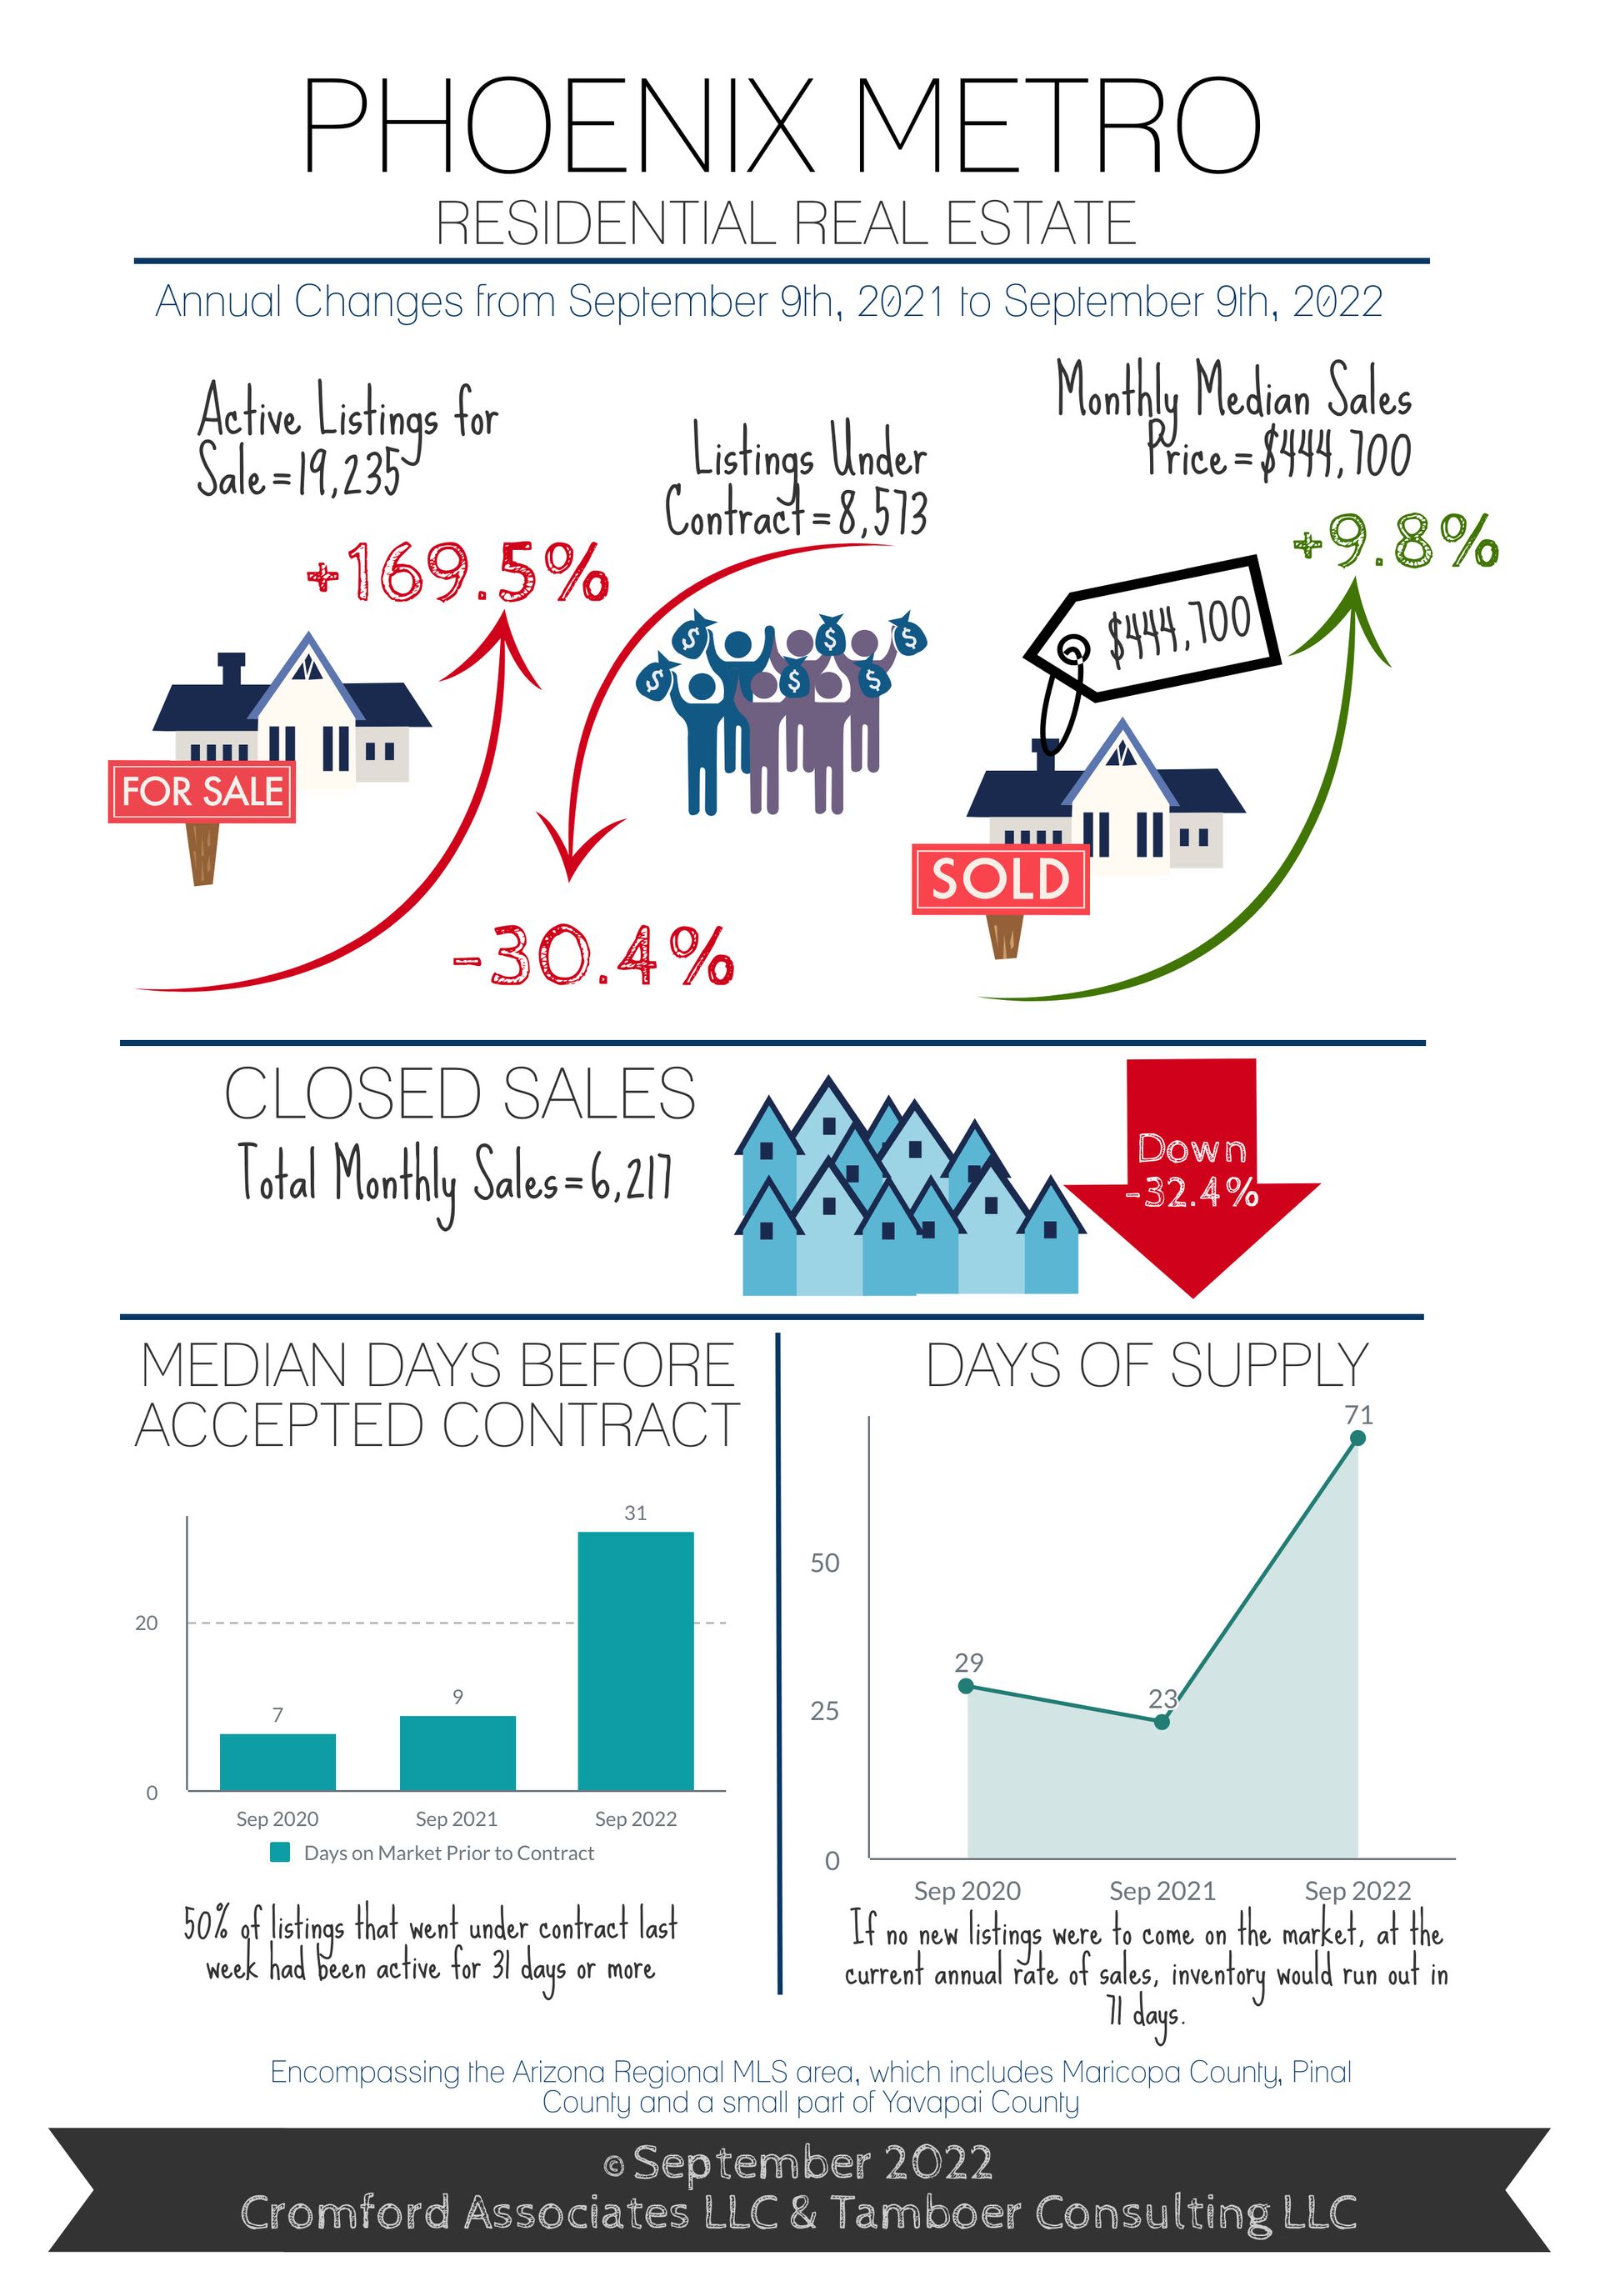
For Buyers:
The percentage of closings with seller-paid closing costs continues to grow as August and September to date range between 12-13% of total sales in Greater Phoenix, inching closer to the normal range of 25-28%. Areas on the outskirts, such as Casa Grande, Maricopa, Coolidge and San Tan Valley in Pinal County and Wittmann, Tolleson and Buckeye in western Maricopa County all have 20-30% of sales closing with concessions. These areas have more than their fair share of new home subdivisions that contribute to this measure as 32% of new homes that closed in the MLS in the last 6 weeks involved concessions, compared to only 11% of resale homes.
As mortgage rates remain volatile and difficult to predict, it’s important for buyers to get educated on the lending tools designed to ease the impact of dramatic rate swings. Tools such as the “Lock and Shop” option, offered by some lenders to allow buyers to lock at an acceptable rate for up to 90 days, and seller-paid permanent and temporary rate buy-down incentives designed to dull the sting of payment increases.
Buyers who are less affected by mortgage rates, but are looking for the best time to pounce on a home, should know that the 4th quarter of the year tends to be the best time for buyers seasonally. There is often a boost in supply around September and October with sellers eager to close before the end of the year. Once 2023 gets started, contract activity is expected to rise sharply from January through May. The upcoming Super Bowl, Phoenix Open and Spring Training events are expected to generate more open house traffic and exposure for active listings.
For Sellers:
The last 3 weeks saw more hikes in mortgage rates, rising from recent low weekly averages of 4.99%, 5.22% and 5.13% in early August to 5.55%, 5.66% and 5.89% in late August and early September. A similar spike happened last June when rates spiked from an average of 5.09% to 5.81%, also within 3 weeks. The result was a 28% drop in weekly accepted contracts over the course of 4 weeks and the worst July for closings since 2007. Then rates got better, dropping to an average of 4.99% by August 4th. The buyer response was near immediate with a 25% boost in accepted contracts within a 4 week period. The latest spike has unfortunately resulted in another dramatic drop in buyer contract activity, down 14% in 2 weeks.
For now, the housing market is not for the faint of heart, only serious sellers need apply. Gone are the days of buyers waiving appraisals and inspections, Wall Street cash buyers offering more than asking price, and multiple offers. Over the last 6 months, the housing market has shifted away from an intense seller market to a delicate balance, the predictability of which relies on the behavior of interest rates. Until rates move below 5%, demand in the coming months will most likely remain weak, thus putting more pressure on sellers to reduce their price, offer permanent rate buy-downs, and pay for their buyer’s closing costs. Many sellers are sitting on significant equity in their homes and while the cost to sell has increased significantly, a great majority of those who have owned their property for at least 2 years can bear that extra cost without distress and still close with a significant profit.
Commentary written by Tina Tamboer, Senior Housing Analyst with The Cromford Report
©2022 Cromford Associates LLC and Tamboer Consulting LLC









