September 2026 Phoenix Arizona Real Estate Snapshot
Mortgage Rates: We’ve Had Worse.
Home Prices are Stable, Payments are Volatile.
For Buyers:
The best description for the housing market vibe this month is disappointment. Average mortgage rates are front and center again, and not in a good way. After hovering around 6.75% for most of August, conventional rates shot up to 7.24% in less than 2 weeks in anticipation of the Federal Reserve raising the Fed Funds Rate. That is nearly a half percent increase, equating to roughly a 5% increase in a principal and interest payment. On a $3,000 monthly payment, it’s an extra $150, which isn’t enough to disqualify most active buyers but the “shock and awe” has stalled demand back to 2023 and 2024 levels.
Home values didn’t crash in 2023 or 2024 when rates were routinely over 7.25%, and market indicators do not support a crash in 2026. However, they may glide with less demand. Ironically, it’s not the rate itself that has caused such a sharp pause in buyer activity, because more homes sold in previous years with the same or higher rates. It’s the volatility of the rate. Buyers typically pause when the rate is actively rising or actively falling, waiting for it to find stability. This pause provides a window of opportunity for those buyers who can shoulder a higher payment temporarily and negotiate a better deal on the price or terms of their purchase. When rates decline again, they may refinance their home and enjoy a lower payment.
Those who purchased in 2023 at 8% in October were able to refinance at 6.6% by December, or 6.1% by September 2024. Rates increased to 7.25% by January 2025, and those buyers were able to refinance to 6.1% by September. As a rule of thumb, every 1% change in mortgage rate equates to roughly a 10% difference on the principal and interest payment.
Meanwhile, incentives remain primarily focused on seller-paid closing costs and rate buydowns that effectively drop a buyer’s principal and interest payment temporarily by 10-20% for a year or two. In August, 59% of all MLS sales involved some form of seller-paid incentive of this nature, with a median cost to the seller at just over $10,000. The top price range for incentives is $350,000-$400,000 at 71% of sales.
The 4th quarter is seasonally the best time to be a home buyer in Greater Phoenix anyway, so expect new construction incentives to ramp up as well. Buyers who can shoulder the higher rate can negotiate better terms on the home they want today, and get the payment they want when rates decline in the future.
For Sellers:
Higher mortgage rates are nothing new for the housing market, and the tools used to sell homes over the last 3 years are still effective today. However, sellers should be prepared for longer marketing times as the calendar approaches the holidays. It’s not uncommon to see a median of 50-60 days on market prior to an accepted contract in the 4th quarter. October is a very popular month for new listings, especially in luxury and retirement communities as the temperatures drop, but it doesn’t always coincide with a boost in demand.
With this in mind, long-term tracking tells us consistently that properties that go under contract within 15 days of listing typically get 99% of their original asking price on average. Listings with 1-2 months on market average 95% of their original asking price, and those with 3-4 months on market average 90%. Buyers have consistently negotiated around 97-97.5% of the last list price for nearly 2 years, so the closer sellers can get to where the buyers believe the price should be, the faster they will get a contract close to asking price.
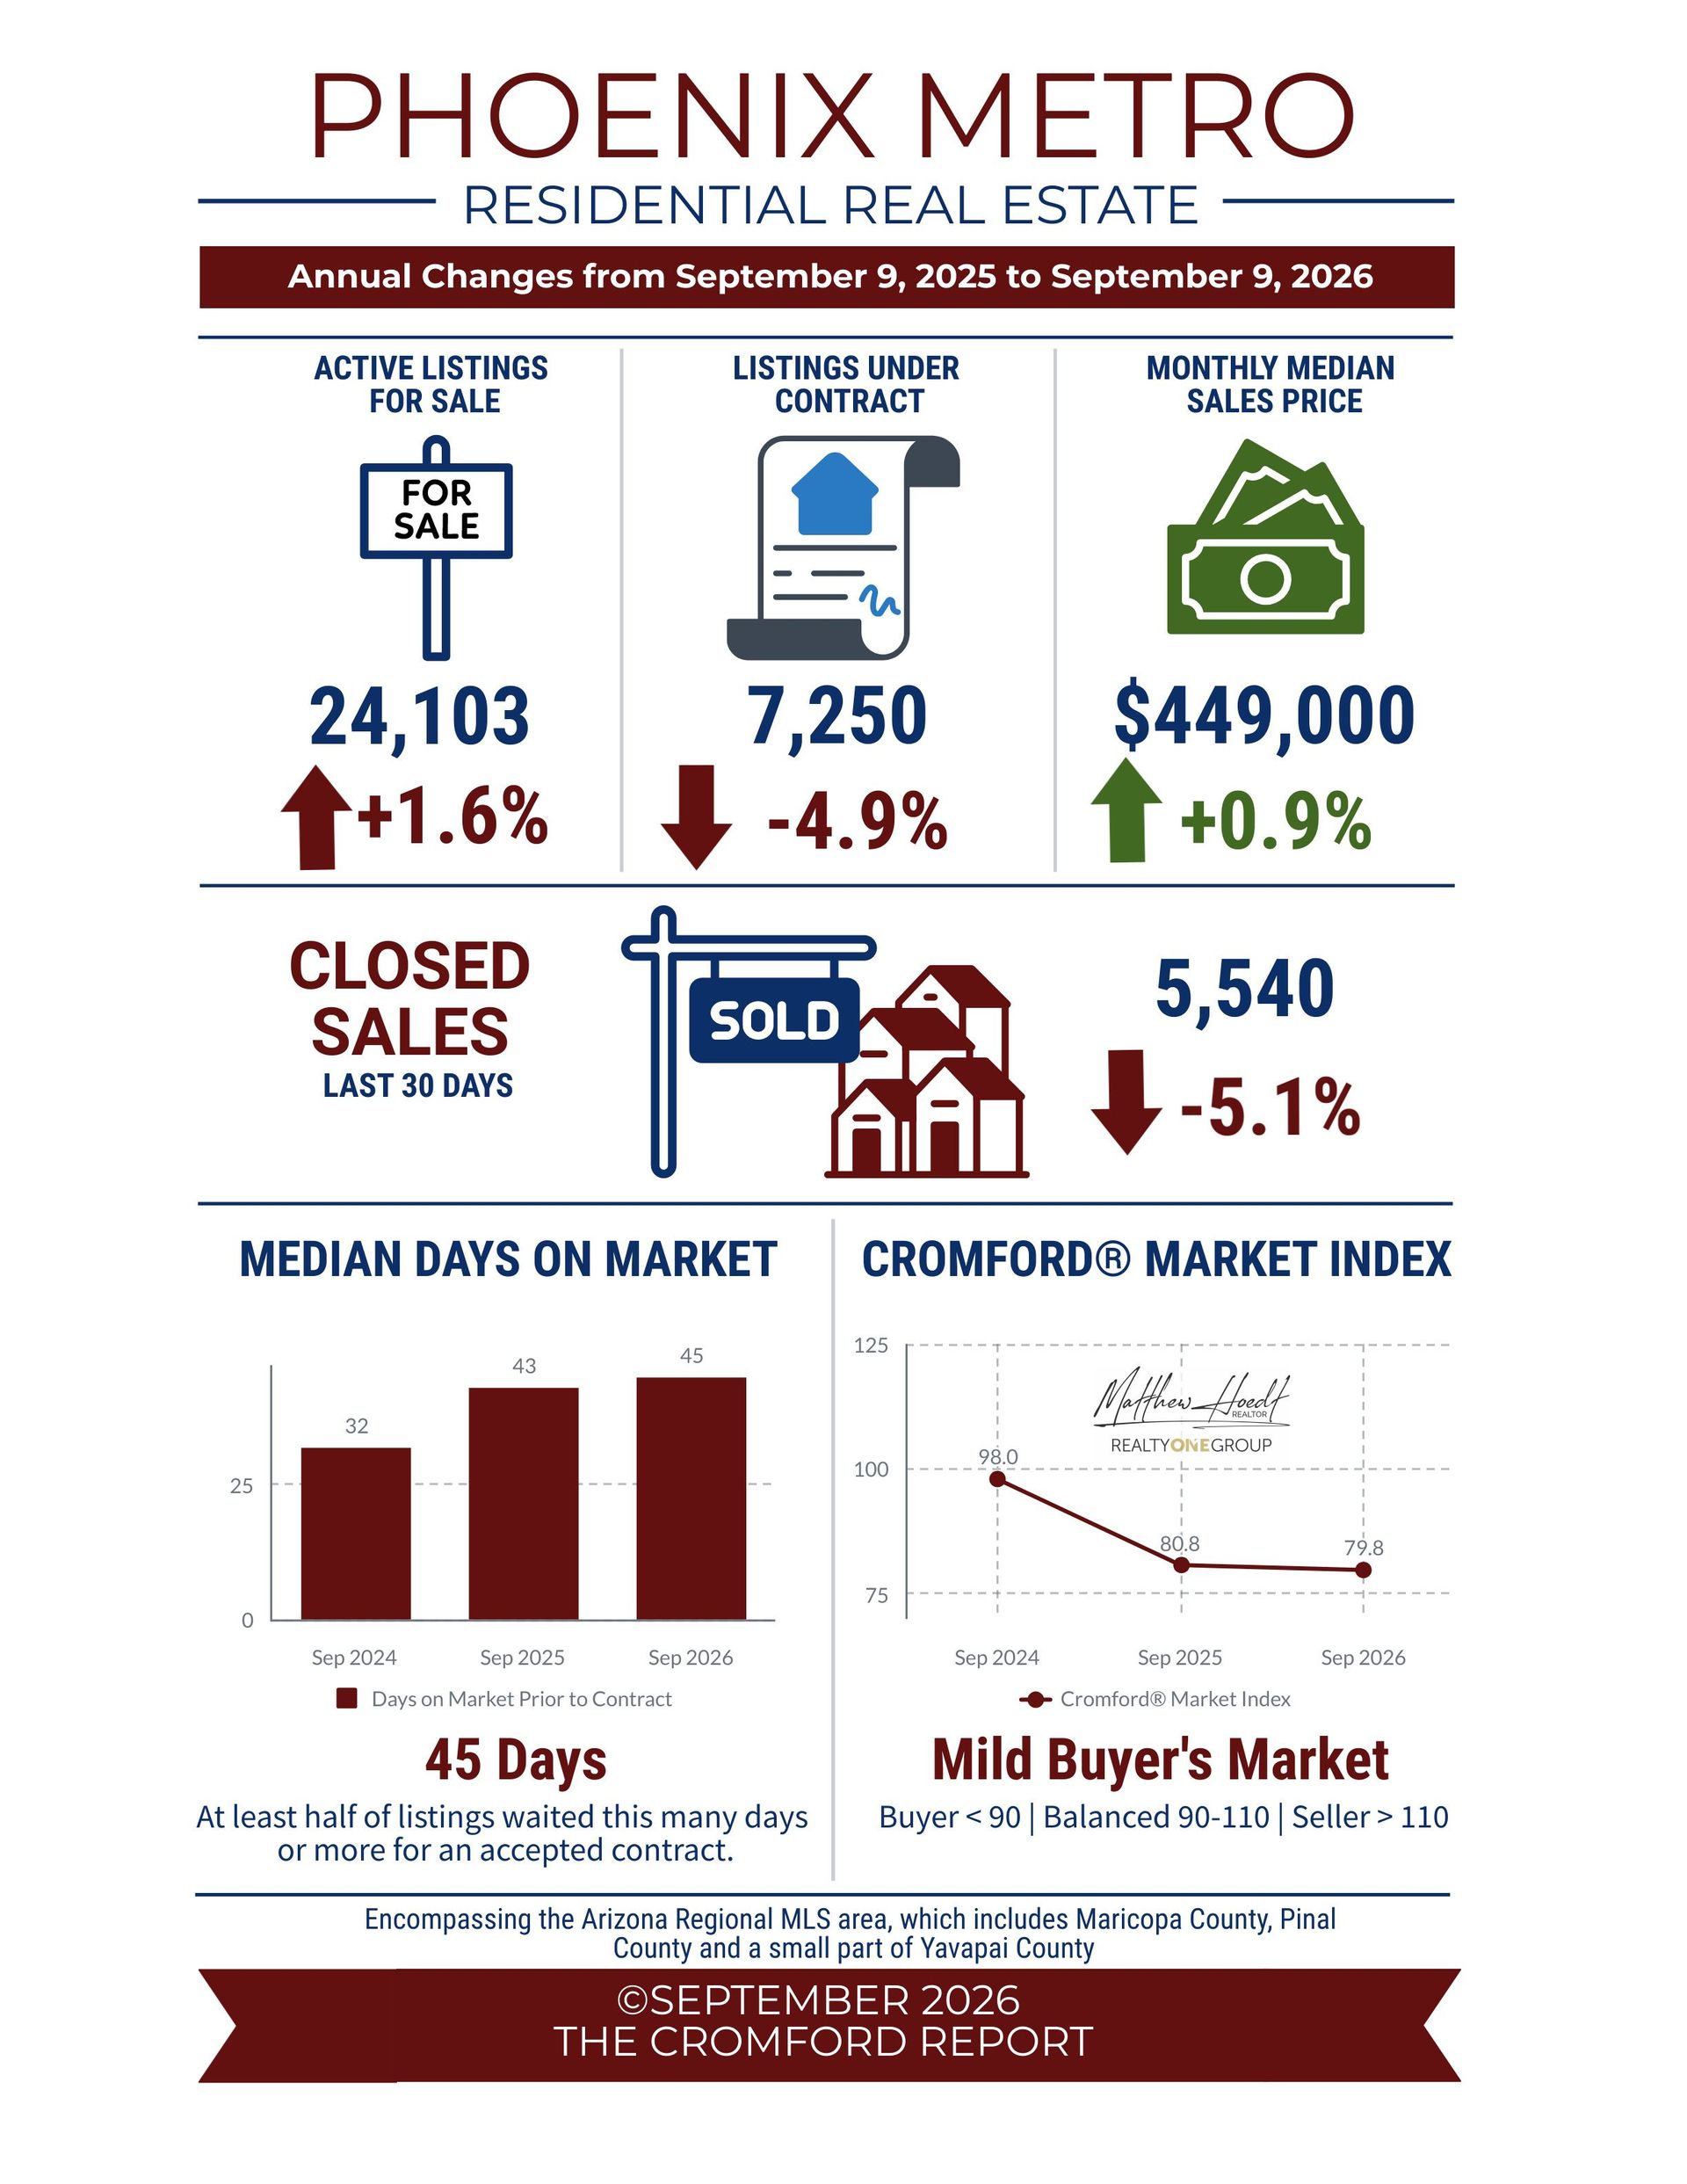
August closings were down 6.3%, the first time all year that monthly sales did not outperform 2025. However, the luxury market over $1.5M continues to be strong with August sales up 15% over last year. More specifically, sales over $3M were up 59% in August with 62 closings compared to 39 last year. Luxury buyers do not rely on mortgage rates; instead, they are influenced primarily by stock market performance and corporate profits.
Corporate profits hit another record in Q1 this year and the stock market has remained resilient through the year.
Commentary written by Tina Tamboer, Senior Housing Analyst with The Cromford Report
©2026 Cromford Associates LLC and Tamboer Consulting LLC