April 2026 Phoenix Arizona Real Estate Snapshot
Single Family Home Prices Remain Stable Year-Over-Year
Rates Decline Again in April
For Buyers:
March was an eventful month as rates spiked from 5.99% to 6.64% per Mortgage News Daily. The spike was a direct response to uncertainty over the Iran war and its affect on U.S. inflation. Once the unemployment report was released showing an improvement from 4.4% to 4.3%, rates began drifting back down. By the time the CPI inflation was released at 3.3%, up from 2.4%, it had already been priced into the rates so there was little effect. As of mid-April, rates were back to 6.3% and trending down.
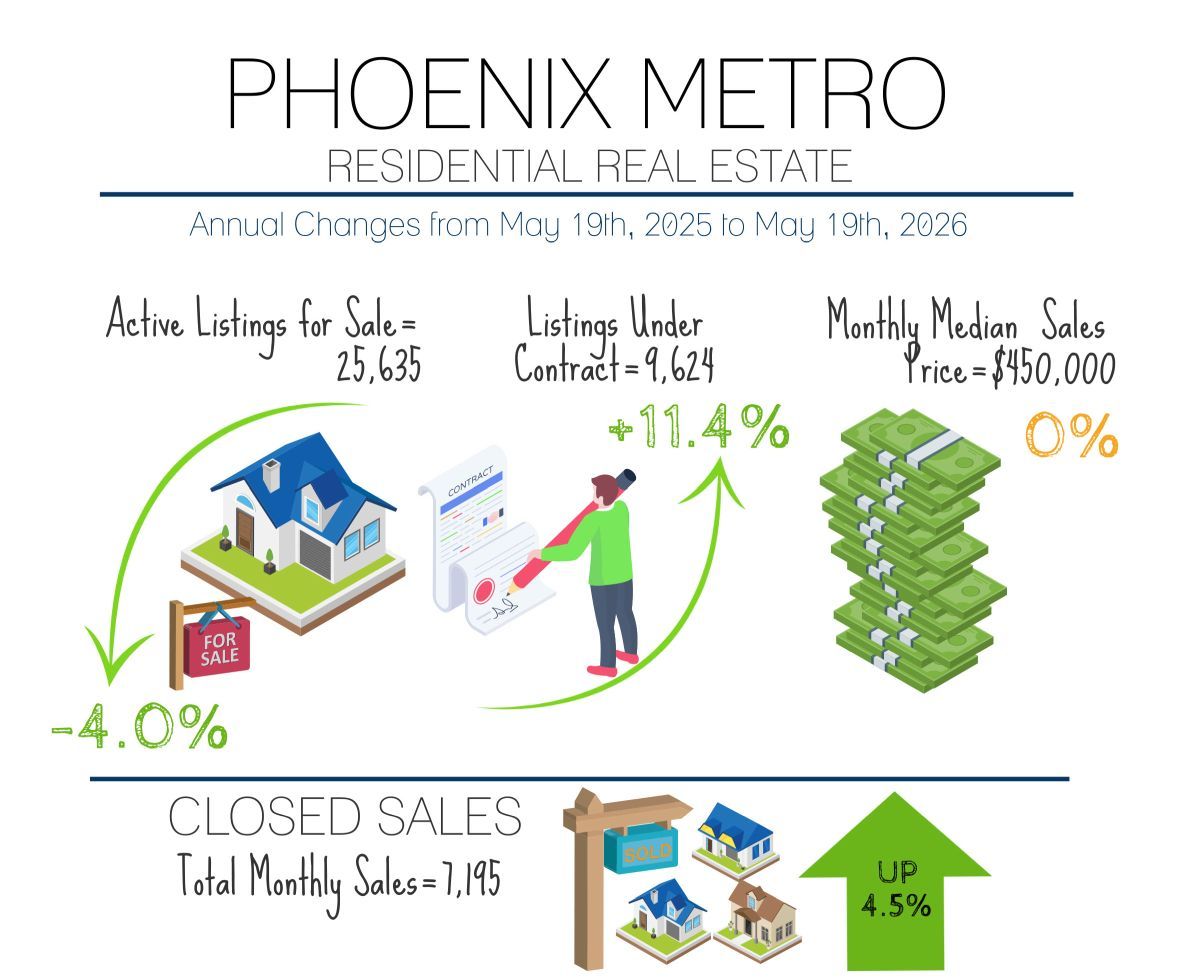
The effect of the rate disruption was a decline in buyer contract activity, in March they were up 10% and in April up just 1%. Contracts could begin to return as rates fall below 6.25%. The lesson buyers have learned over the past 3 years of volatile mortgage rates is patience. Rates have a recent history of knee-jerk spikes in times of unexpected uncertainty (i.e. tariffs, trade through the Strait of Hormuz), and declines after the shock wears off.
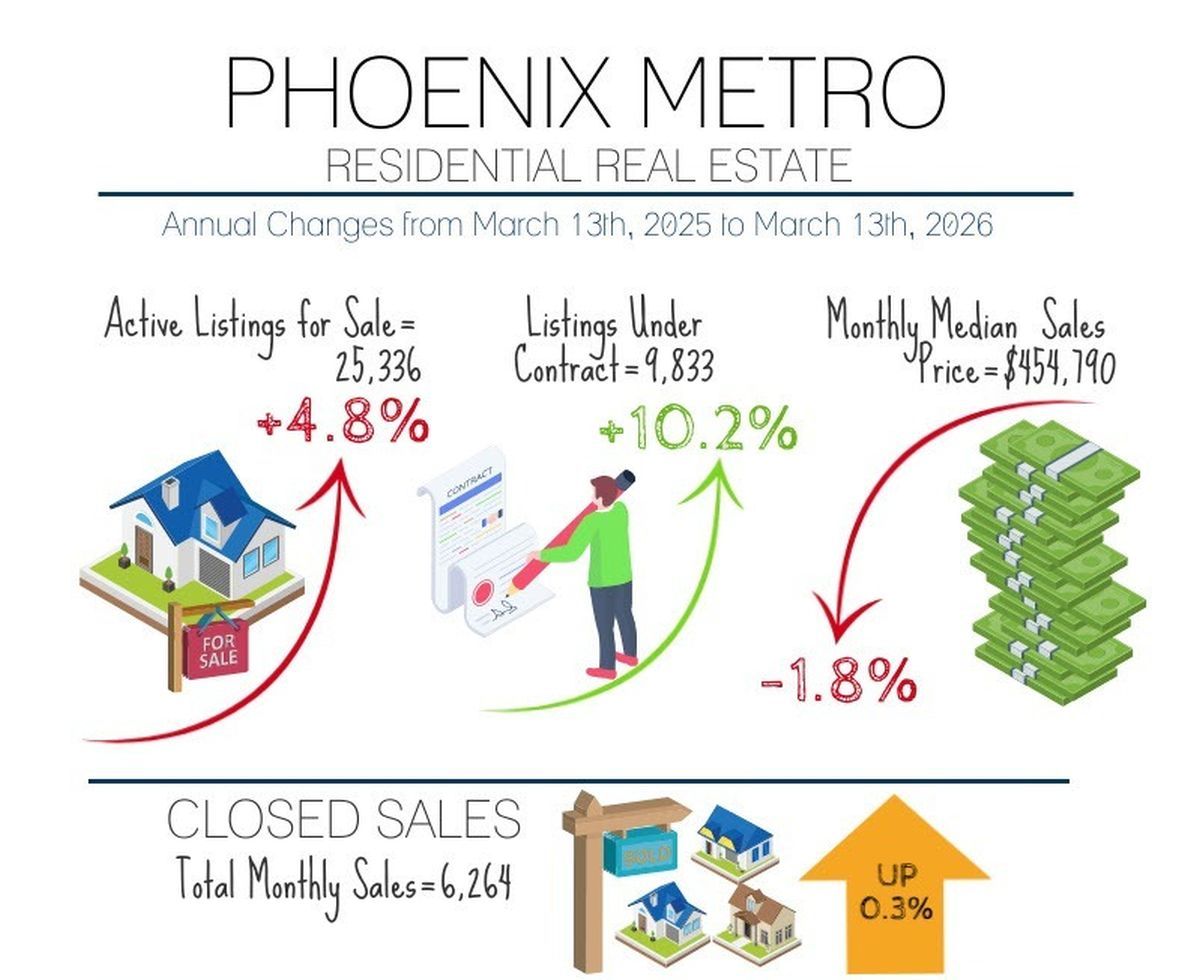
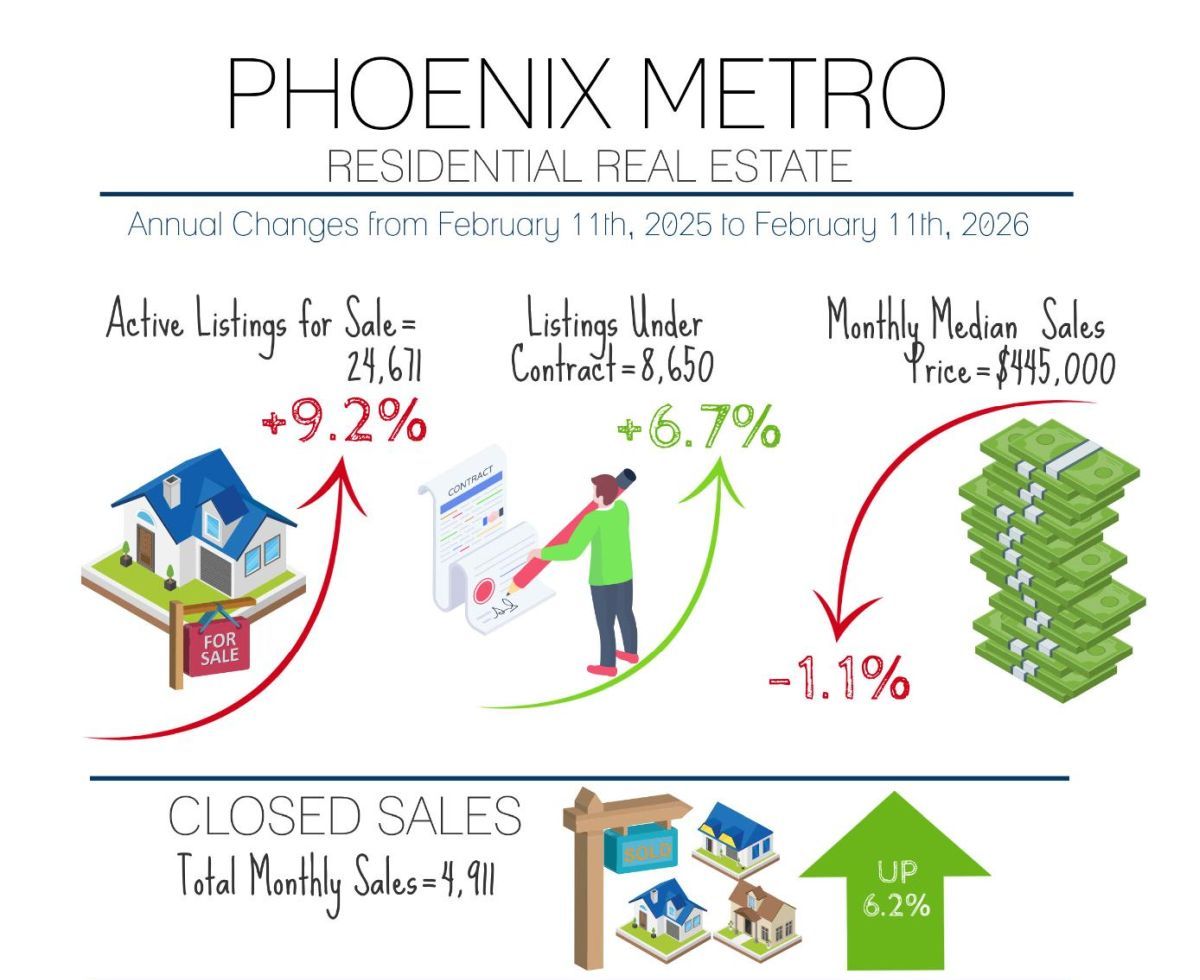
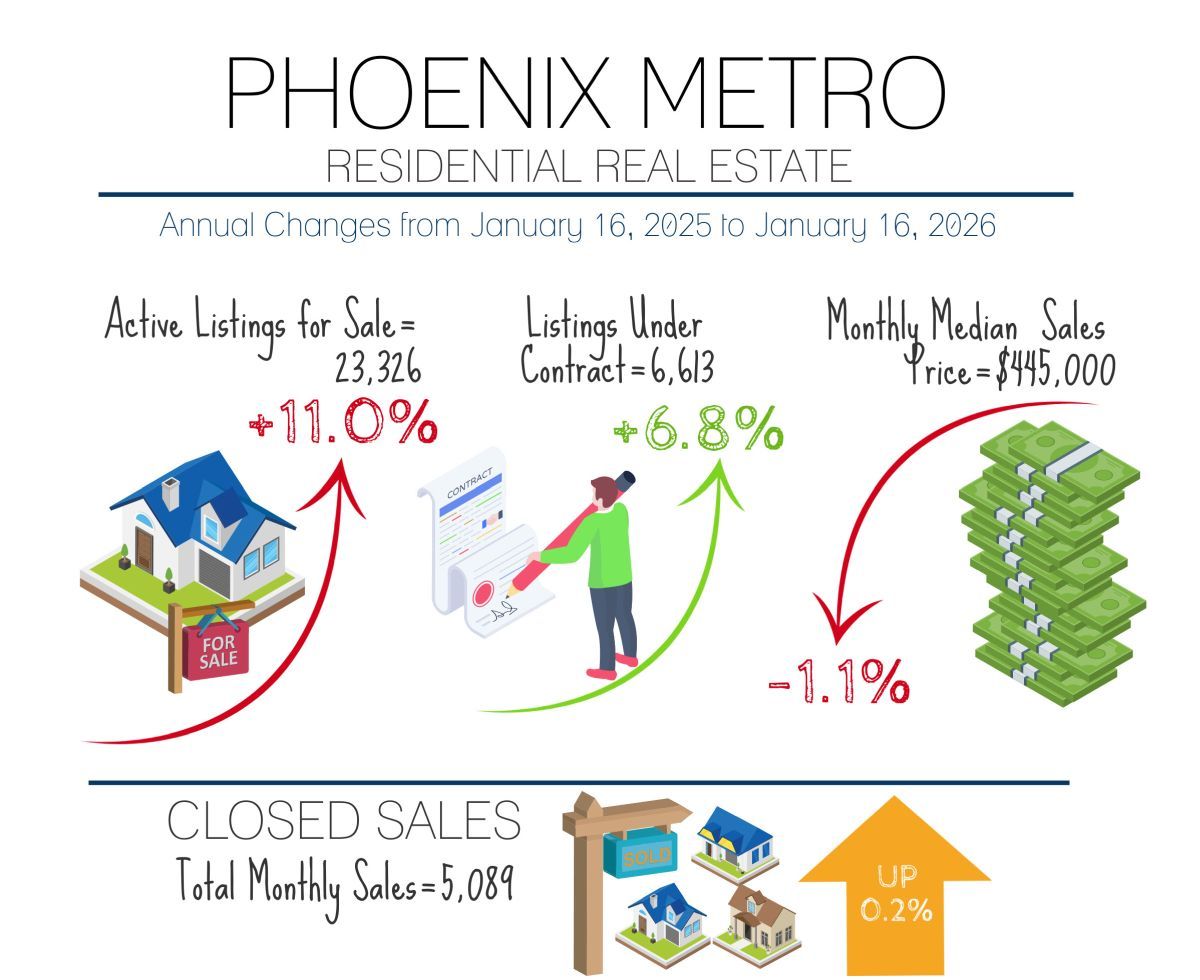
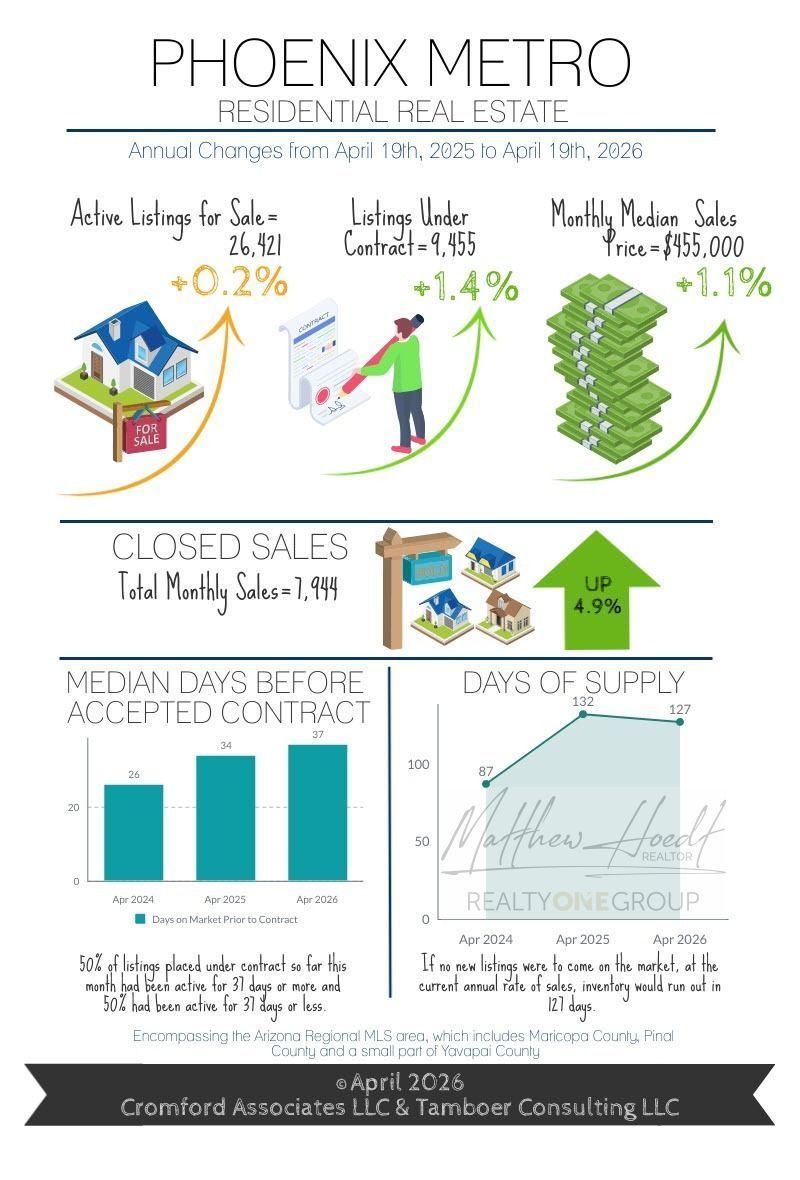
The increase in supply seen in January and February stalled in March and now in April as well. In February supply was up 9% over last year. In March supply was only up 4.8% and in April it is barely up 0.2% thus far. With both contract and listing activity stalled, they have cancelled each other out, thus maintaining the status quo for home prices.
While the conflict with Iran is not settled, the markets are responding as if they expect it to be a short-term influence on inflation. If that proves to be true, then there will be little impact on home values as they typically take 3-6 months to respond to a prolonged disturbance in the force. Since September 2022, the median mortgage rate is 6.89%. This puts the current 6.3% mortgage rate well on the low side of the last 3.5 years.
For Sellers:
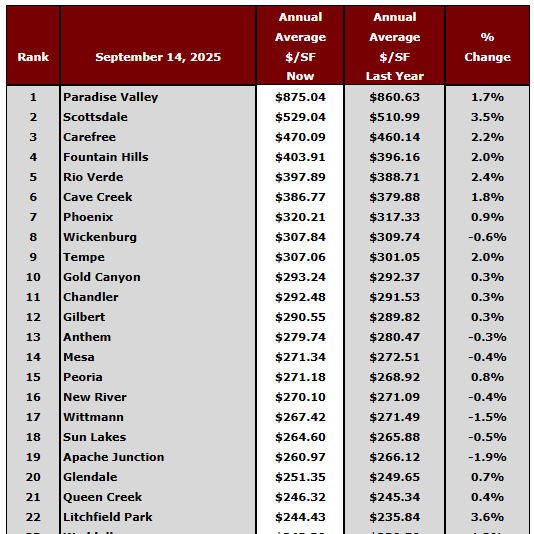
Sellers have the least advantage in the condominium market under $300K as supply is up 20% over last year and contracts in escrow up only 13%. April sold prices are down 9.5% from last year in this segment with the median size sold at 1,048 sqft, historically prices for this segment are similar to where they were 5 years ago around May 2021. Conversely, Single family homes between 1,200-2,400 sqft have shown the most stability in prices over the past 3 years with minimal fluctuation.
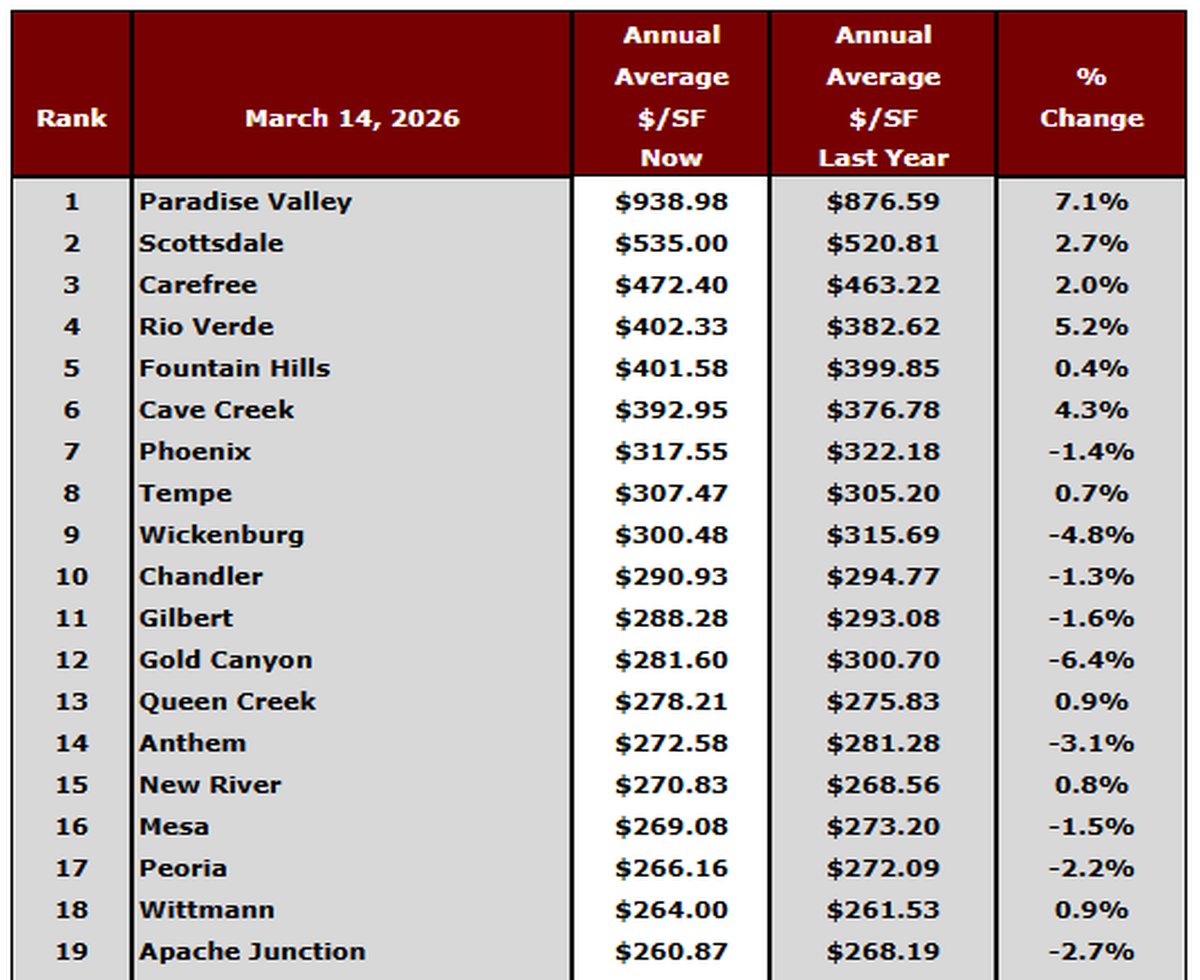
The median sized single family home sold in Greater Phoenix this year is 2,003 sqft, which is 318 sqft bigger than 2001’s median of 1,685 sqft, 25 years ago. Typical home sizes vary based on city, which is reflected in their median sales prices. For example the 2026 median sized home sold in the city of Phoenix is 1,798 sqft and the median price is $482K. Compare that to a newer cities like Chandler where the median size is 2,061 sqft at $558K and Queen Creek at 2,659 sqft and $688K. While the Valley has endured a buyer’s market since November 2024, price trends are within 1% of last year’s prices for the majority of common-sized homes:
Commentary written by Tina Tamboer, Senior Housing Analyst with The Cromford Report
©2026 Cromford Associates LLC and Tamboer Consulting LLC