August 2026 Phoenix Arizona Real Estate Snapshot
What Homebuyers Get for Their Budget in 2026,
What Sellers Should Watch this Summer
For Buyers:
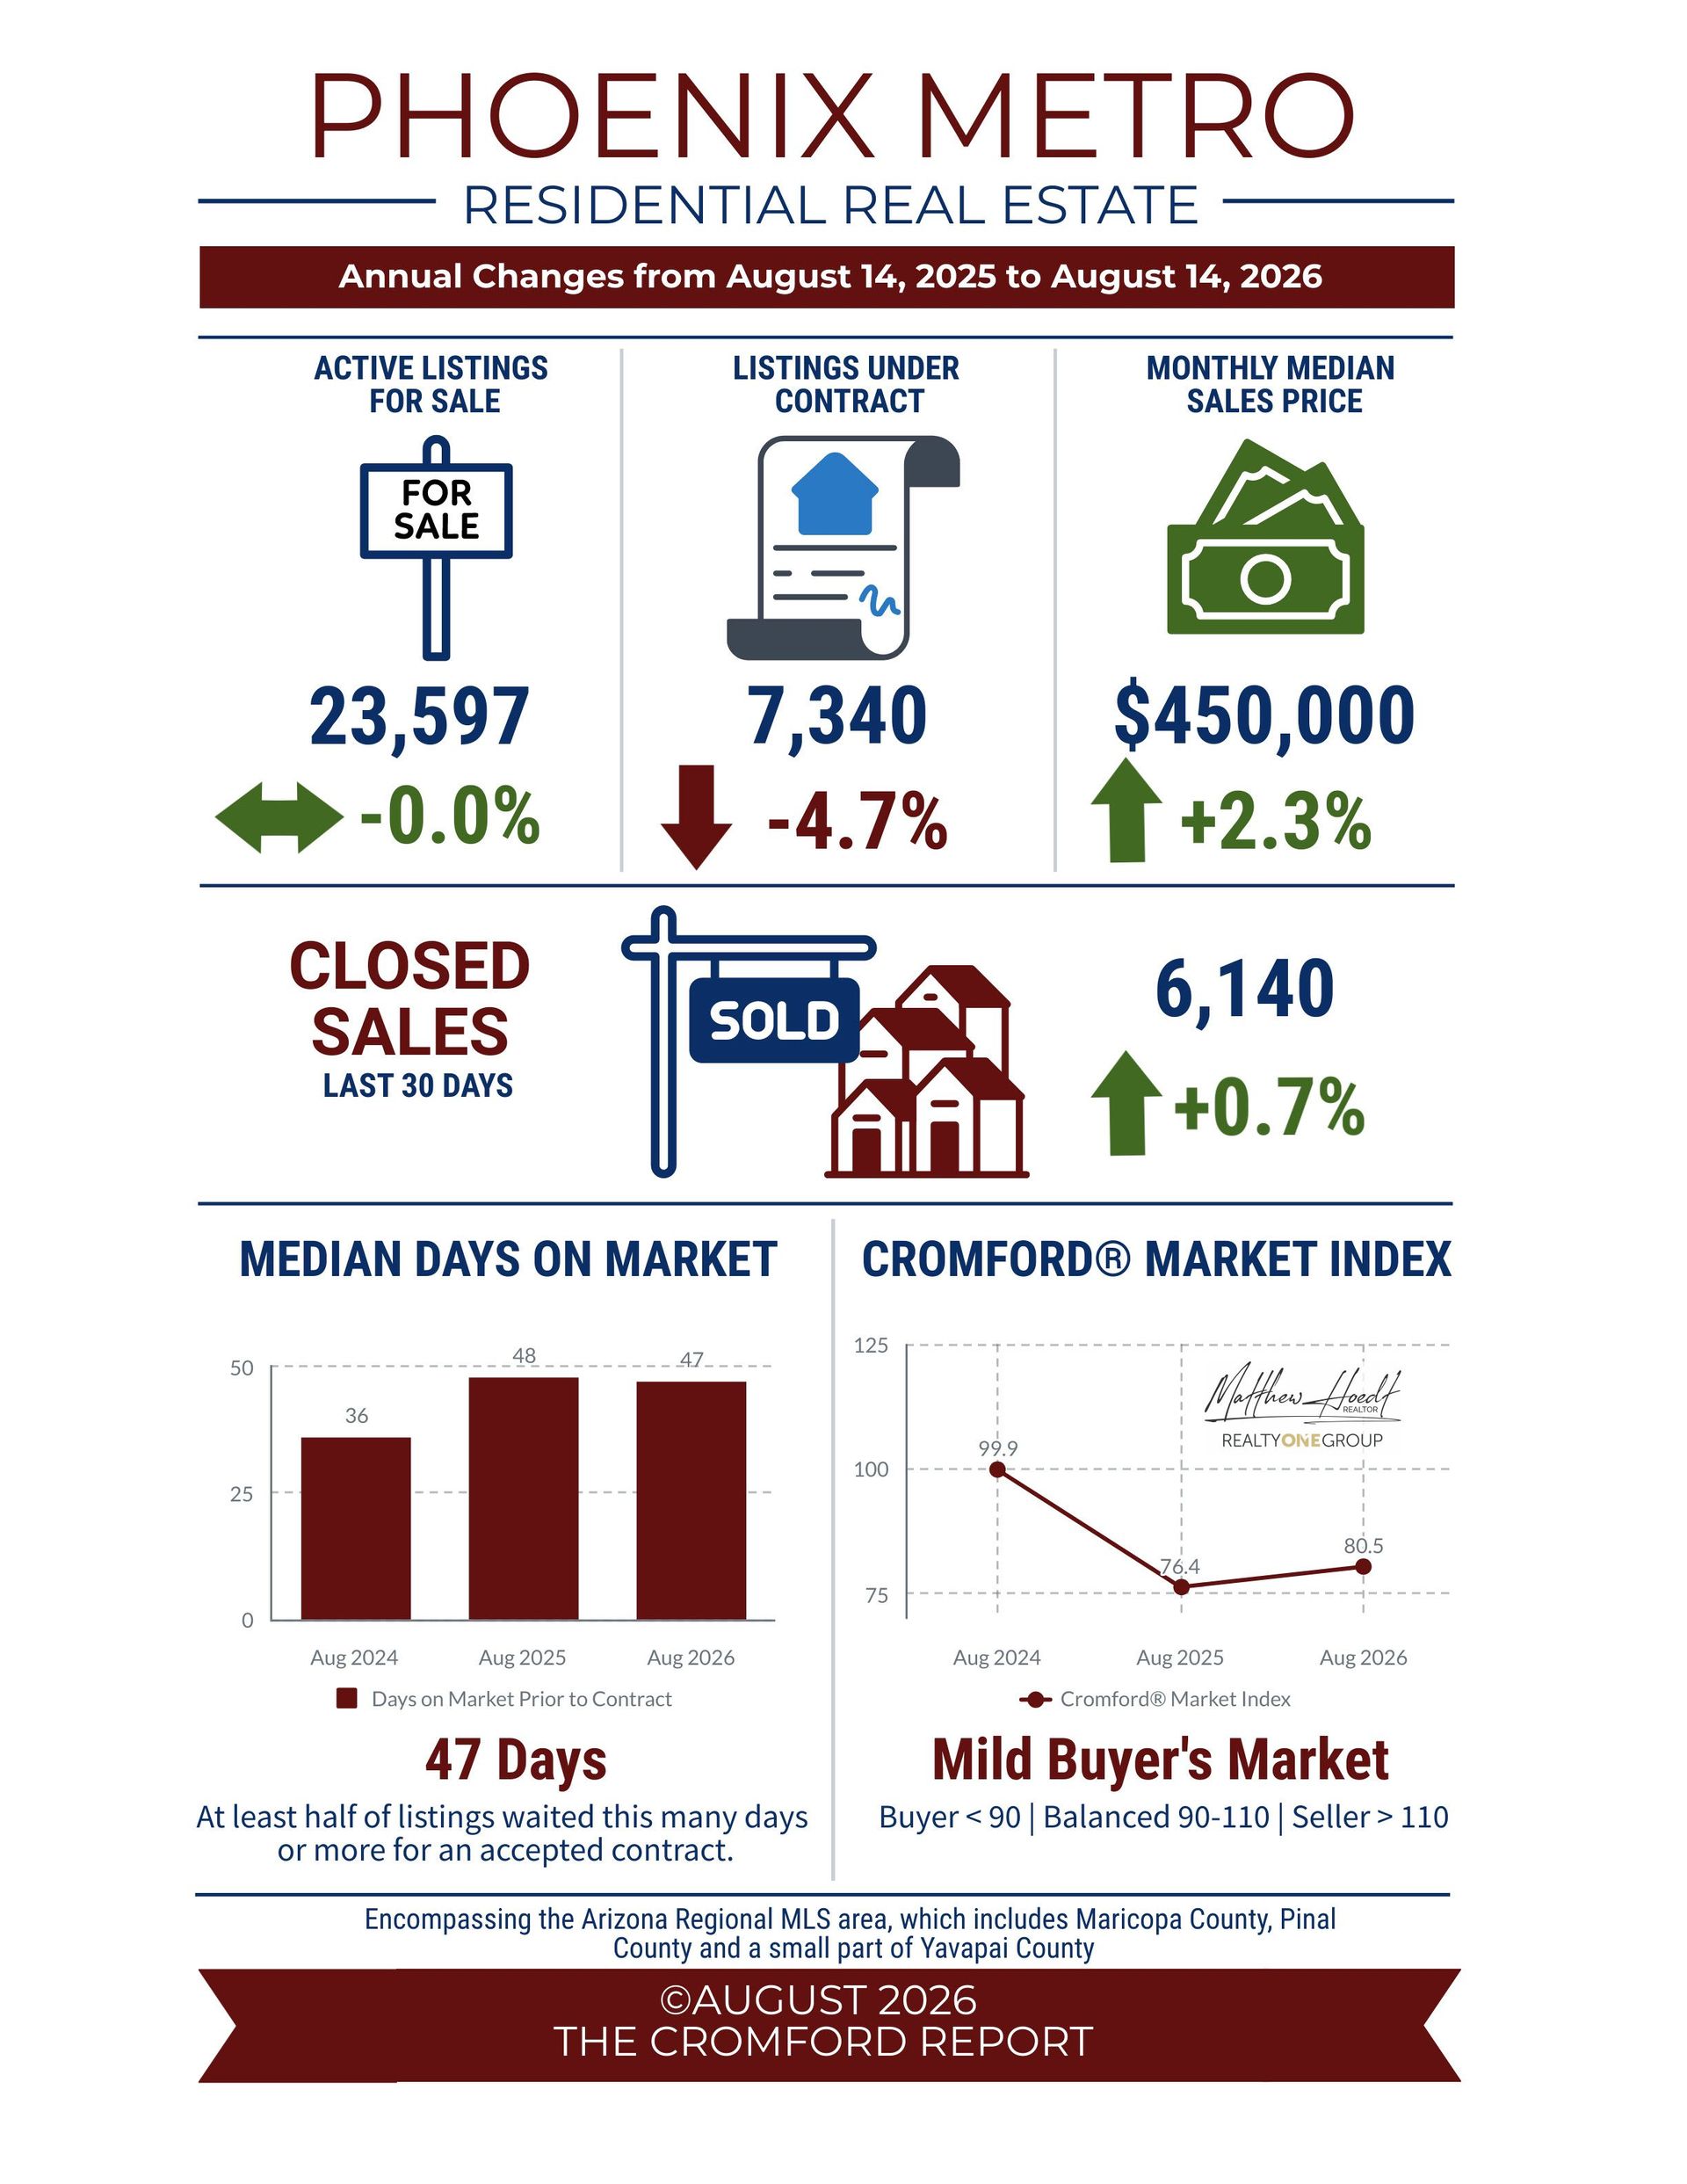
The topic of affordability is hot right now, especially when it comes to first time buyers. However, often the only measure quoted in articles is the median or average sales price without identifying what that looks like. In 2026 to date, the median size single family home sold in Greater Phoenix is 2,001 square feet, with a median sales price of $450,000. This is larger than what many first-time homebuyers need or want with their first home.
Growth areas like Pinal County, Buckeye, and Surprise offer larger new homes for a buyer’s budget with attractive incentives that cover closing costs and even buy down the mortgage rate. Fewer homes come on the market during the summer, so sellers are under less pressure to reduce their prices. However, the spring season is over and fewer showings means buyers have an easier time landing homes in the sub-$400K price ranges, which have been very hot this year throughout the West and Southeast Valleys. Closings over the past 3 months between $300-400K show 70% of sellers paid the buyers’ closing costs at a median of $10,485, which typically includes some form of mortgage rate buydown to compensate for the increase in rates.
For Sellers:
It’s the summer slog for sellers right now. Homes sit longer, fewer new listings enter the MLS, and supply becomes stale. Lack of activity can leave sellers restless and frustrated. Keeping up with the following reports can provide valuable information to help them decide whether to be patient or make a change. While broad Greater Phoenix measures provide some insight, the most useful will be specific to zip code and price point. Here are just a few basic reports available through the Arizona Regional MLS and The Cromford Report that could be helpful:
Aligned showing reports - Lets sellers know how many showings were conducted in their price range and zip code within any given time frame such as the last week, month, or since they’ve been listed.
New contracts accepted weekly - Counts how many contracts were accepted in their zip code and price range on a weekly basis. Sometimes no contracts are received for weeks within a certain price range, in which case patience may be the key. Sometimes there may be 3-5 per week; finding out why those properties were picked over all others could reveal what’s in the buyers’ minds. For instance, perhaps the buyers are choosing homes that are larger, have more amenities, or are remodeled.
Supply counts weekly - Counts how many listings are in their zip code and price point competing for the number of contracts written every week. If supply is rising and weekly contracts are not, it’s time to consult with the listing agent and discuss strategy. If contracts are rising and supply is dropping, then patience may be appropriate.
Average list price per square foot AT CONTRACT - Identifies a “sweet spot” where listings were priced at the moment a contract was received and accepted. Properties well above this measure need to also be well above average in condition, amenities, and location. For example, a home may be smaller but on a extra large lot or include a separate guest house, which would justify the higher price per square foot.
While these reports can be helpful during the summer lull, they are just a glimpse of what professionals do and track behind the scenes to make recommendations and sell homes. By late September, new listings will start to increase. Staying on top of what the buyers are saying and doing today will help drive strategy and pricing to win a contract. The goal is for your listing to be a comp, not a competitor, by the end of summer.
Commentary written by Tina Tamboer, Senior Housing Analyst with The Cromford Report
©2026 Cromford Associates LLC and Tamboer Consulting LLC