May 2026 Phoenix Arizona Real Estate Snapshot
Conflicting Headlines: Is Supply Too High or Too Low?
Listings Under Contract Increase 11% in May
For Buyers:
Two local headlines published this month contradicted each other regarding the active supply situation in Greater Phoenix. The first, published on May 4, was titled “Phoenix housing inventory surges toward record highs.” The associated article stated the current active listing count is “a level only surpassed in two months in recorded history: April and May of last year.” This statement aligns with the last 12 years of historical data, but it doesn’t hold up to 25 years. Today’s inventory count is surpassed by every count recorded daily from 2006-2010. The highest count ever recorded by The Cromford Report is November 2007, where supply peaked at nearly 58,000 active listings before prices collapsed in the infamous 2008 Great Recession, resulting in the largest foreclosure crisis ever experienced. Today’s inventory counts are not remotely comparable to that time in history.
The second headline, published 10 days later on May 14, was titled “Arizona facing home shortage as unaffordability weighs on potential buyers” and declared that Arizona faces an immediate shortage of 56,000 homes, with a long-term shortage of 110,000. So which headline is correct? Is inventory surging to new highs or is it critically low? Surging inventory would put downward pressure on prices while an inventory shortage results in upward pressure. Looking at median sales price measures, they have had little fluctuation for more than two years, suggesting that neither of these theories is reflected in pricing trends.
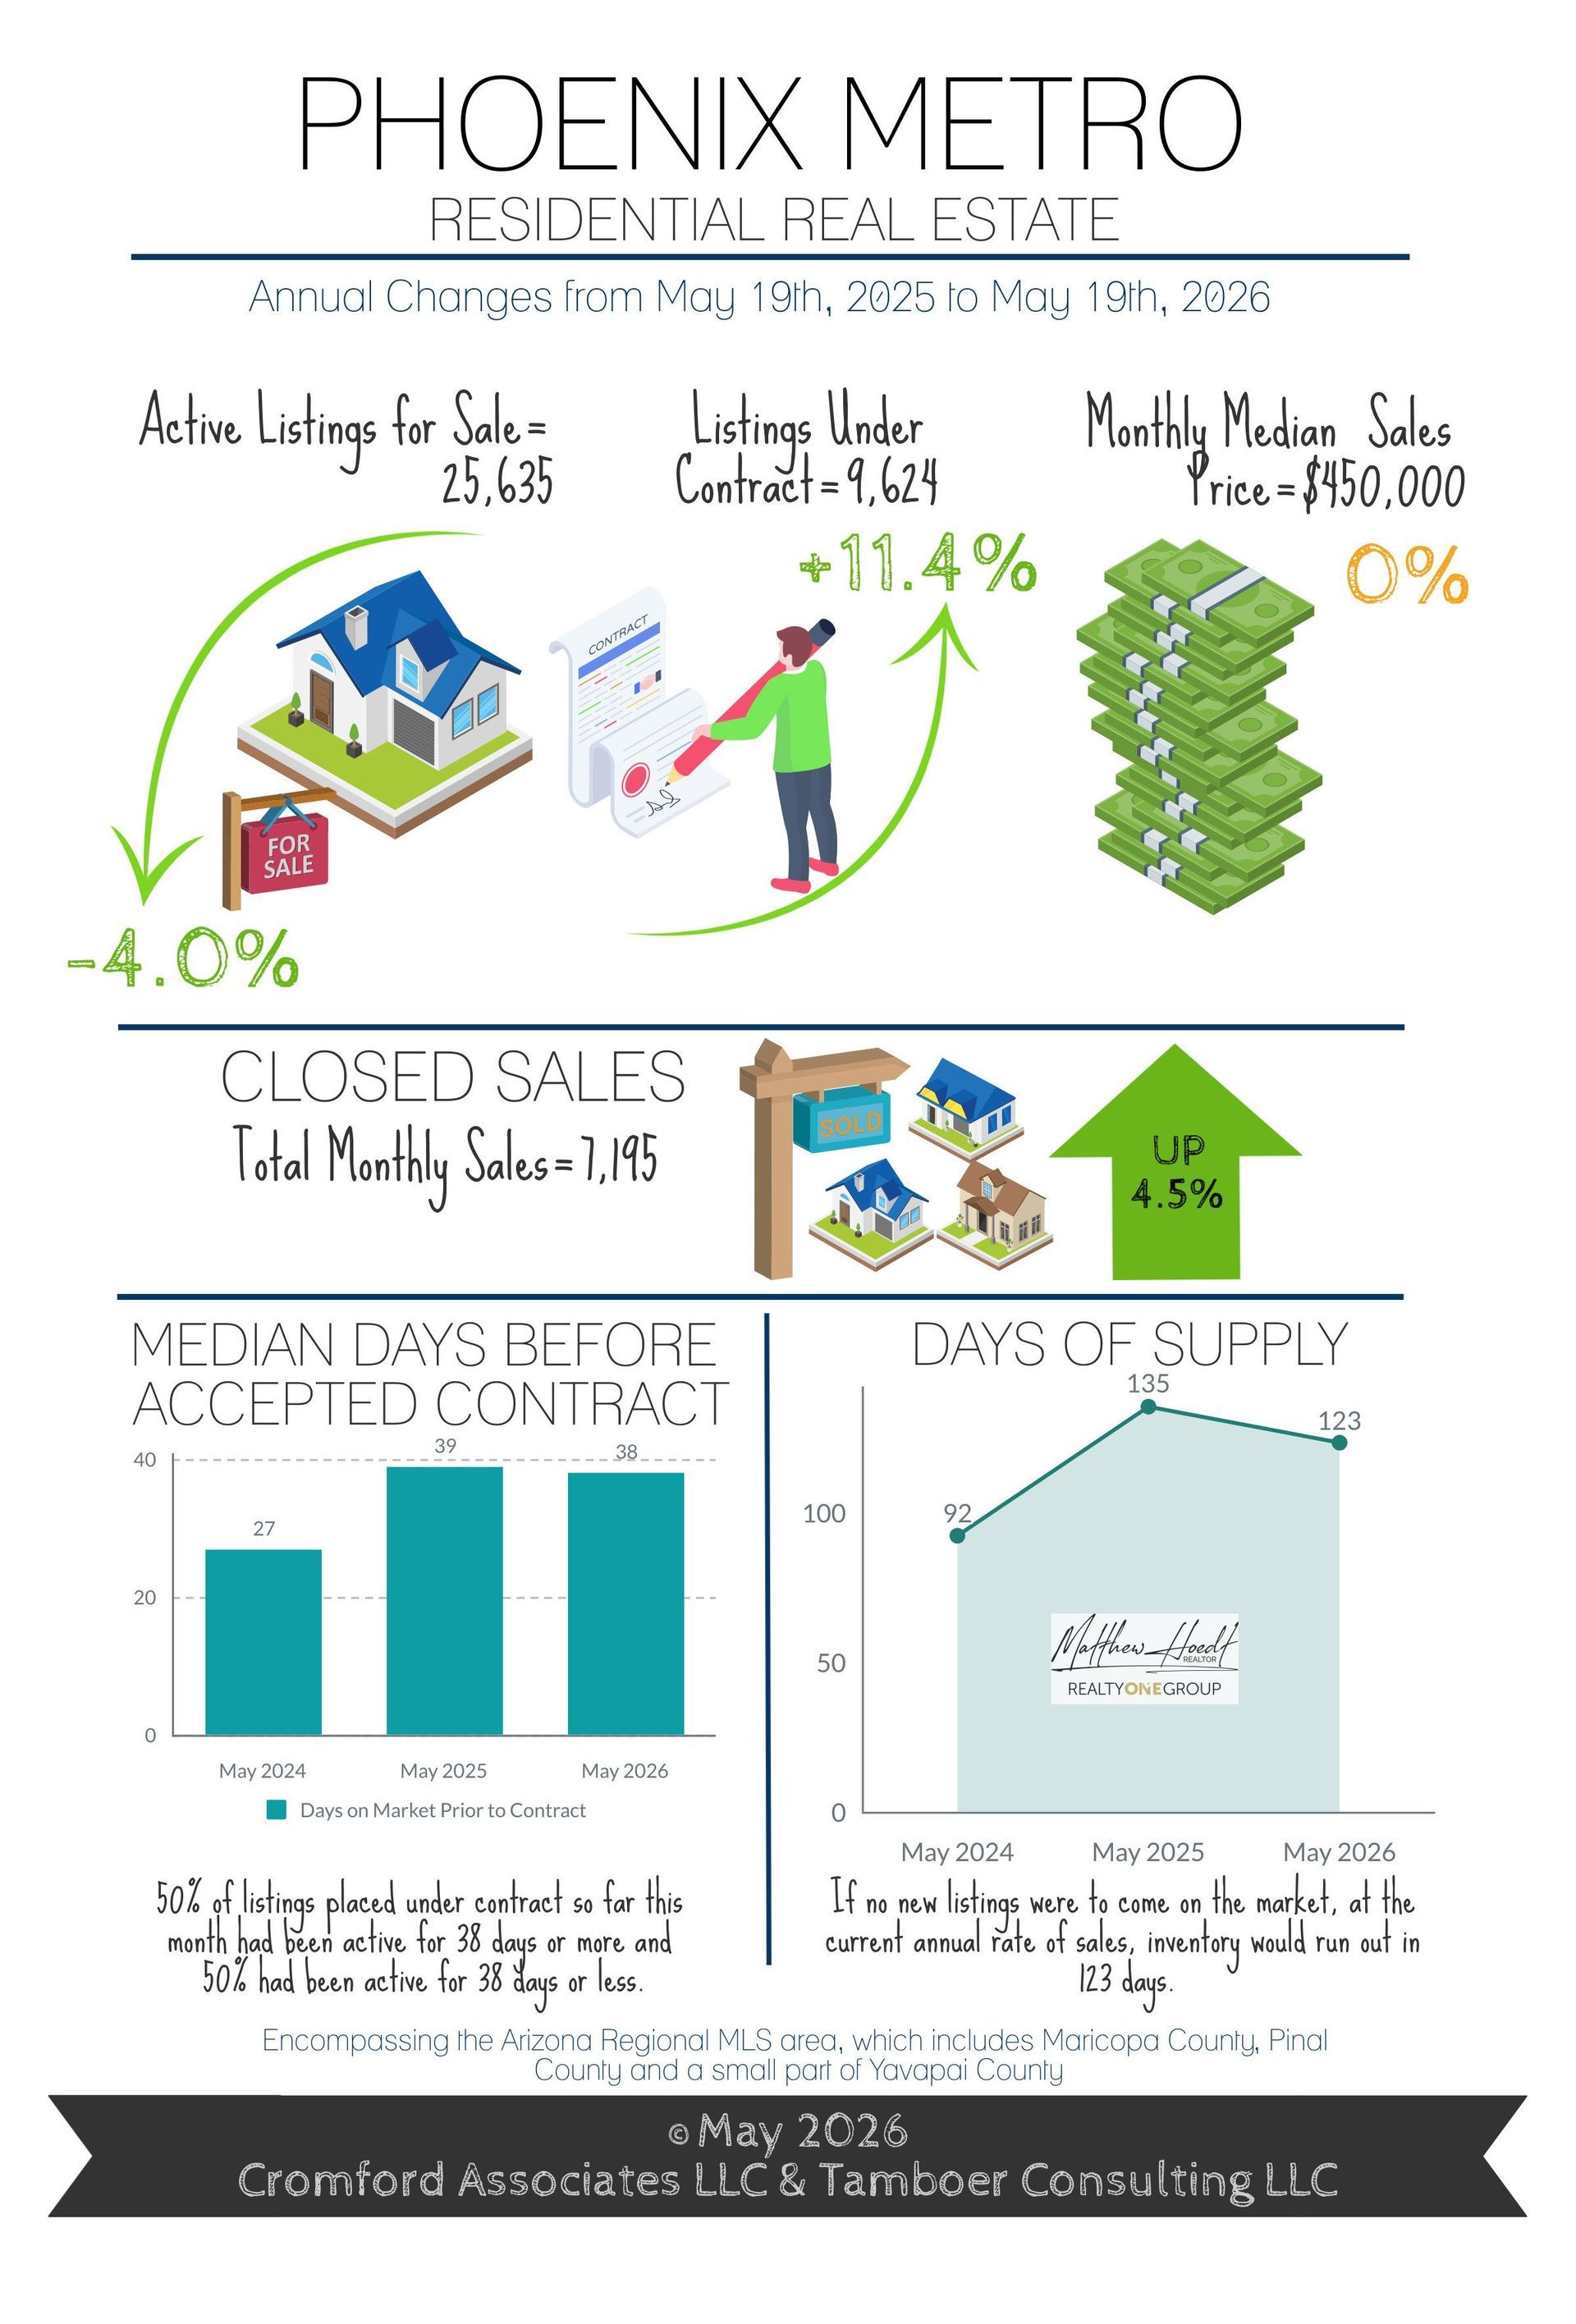
In short, Greater Phoenix supply counts are not breaking records, they are not surging, and they are not critically low. Statistically, active supply is considered within normal range and stable for now. Meanwhile, buyer contracts have improved 11% over this time last year despite recent mortgage rate increases, indicating that buyer demand could increase significantly should economic certainty improve and mortgage rates fall closer to 6.0%.
For Sellers:
The peak spring buying season is nearly over and total sales to date have exceeded last year by 2.9%. The largest improvement is in the luxury market where sales over $1M are up 10% and at a record high. Most impressively, sales over $5M are up 31% over last year and there have been 36 sales over $10M so far, already exceeding last year’s annual record of 32 before the year is halfway through.
As temperatures rise over 100 degrees in May and June, the luxury market typically sees a large spike in cancelled and expired listings. Ironically, this can cause supply to drop more than summer demand and put these areas in a short-term seller’s market. This exact scenario happened last year where Paradise Valley flipped from a balanced market in May to the #1 seller’s market by August due to record listing cancellations, then returned to a balanced market after new listings returned in September and October. While May isn’t over yet, a high level of April cancellations over $1M has already caused supply to drop early, which could be good news for those who choose to stay active over the summer.
As for the rest of the sellers, it’s business as usual as buyers are still in the driver’s seat. Mortgage rates are back to 6.65%, which has the potential to stall buyer activity until it drops back below 6.5%. Home condition matters, seller incentives matter, and pricing matters. Expect marketing times to increase by approximately 6-10 days over the next 2-3 months.
https://www.abc15.com/news/local-news/phoenix-housing-inventory-surges-toward-record-highs
Commentary written by Tina Tamboer, Senior Housing Analyst with The Cromford Report
©2026 Cromford Associates LLC and Tamboer Consulting LLC