
October 2022 Phoenix Real Estate Snapshot
More Buyers Got Help With Closing Costs in September; What To Expect for Housing in the 4th Quarter
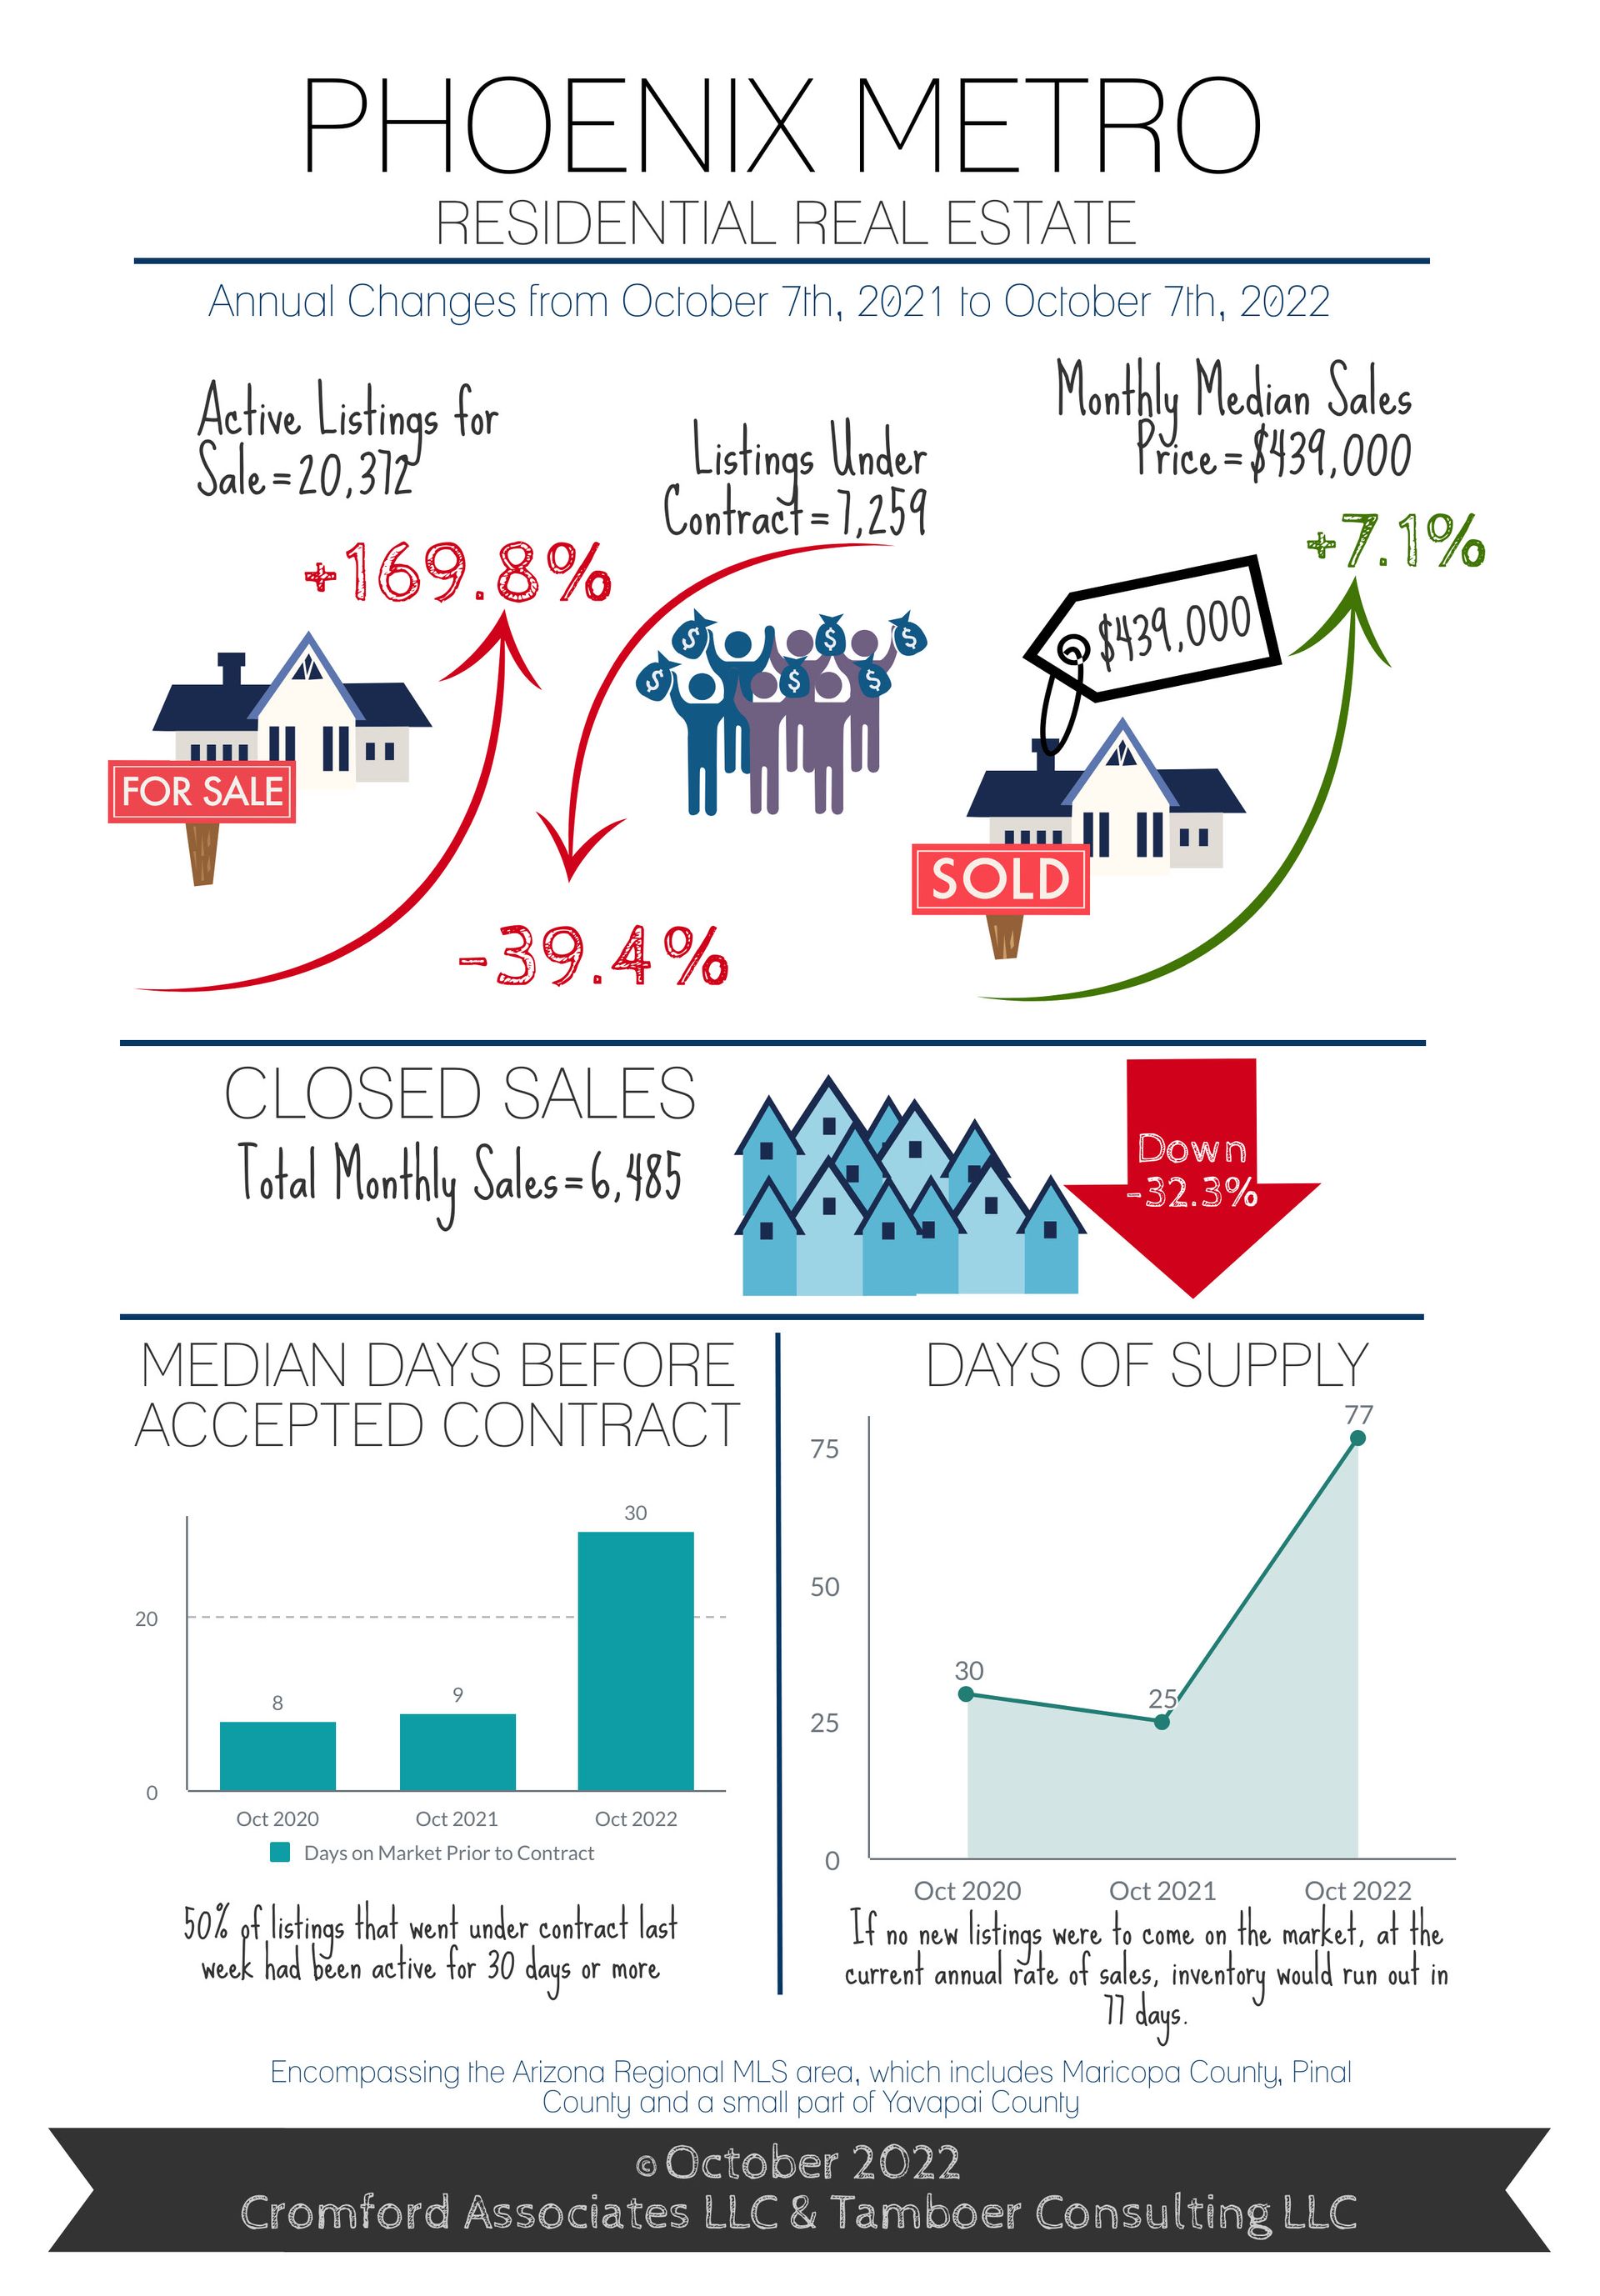
For Buyers:
The price reductions keep coming. Last week when mortgage rates hit 7.0%, the Greater Phoenix housing market responded with 4,427 price reductions, 24% of all active properties in the MLS. At least 50% of those dropped their price by $12,000 or more.
September saw 1,372 closings involving seller closing cost assistance to the buyer, equating to 23% of MLS sales, with a median concession of $7,000. This is a 334% increase from last June’s count of just 316 sales involving concessions. New home sales through the MLS showed 33% with concessions, and 50% at $10,000 or more. OpenDoor, as a seller, paid concessions on 355 transactions, 77% of their sales through MLS, with 50% costing $6,000 or more.
Closing cost assistance is expected to continue to rise into the 4th quarter as mortgage rates continue to stay high and stifle demand for the time being. Aside from paying the buyer’s costs for title insurance, pre-paid taxes, insurance, lending fees, and other closing costs, seller-paid concessions can also be used to buy down a buyer’s mortgage rate, if applicable, and ease the pressure on their monthly payment.
For Sellers:
The 4th quarter is expected to be a test for sellers as mortgage rate hikes have reduced contract activity to levels not seen since 2008. Frankly, it’s not the best time to sell if you have a choice in the matter. Unlike 2008 however, most sellers today do have a choice and those without an immediate need to sell have chosen to wait. This is reflected in some of the lowest counts of new listings coming on the market recorded at this time of year going back to 2001.
Fewer new listings is a ray of hope for existing properties on the market. If new listings are trickling in and new buyer contracts are trickling out, then overall supply does not spike and cause further downward pressure on price. Thus keeping the market in a delicate balance for now.
Prices hit their peak in May, shortly after mortgage rates hit 5% and before they peaked over 6% in June. Once that happened, buyer demand dropped dramatically and the reflection in prices started to show a trend downward. Now rates are near 7% and sale price per square foot is down 9.6% over the course of 4 months, currently measuring less than 1% higher than January 2022 and representing the elimination of appreciation achieved from January through May.
While this is disappointing to those who purchased this year, 66% of active sellers in the MLS (new homes excluded) have owned their home for 2 years or longer. This means that even with the most recent downturn in price, the 2-year appreciation rate from September 2020 to September 2022 is still 40.3% based on per square foot measures, and the median sale price is $112,000 higher, indicating most sellers have enough equity to shoulder the added costs to sell in this marketplace if they must.
Finally heading into the 4th quarter, expect marketing times to increase as they typically do this time of year. Median days on market prior to contract was 31 days last week. From October through December, active days prior to contract is known to rise anywhere from 44 to 56 days historically, with 50% of listings going longer.
The key words for sellers in this “new” market are condition, price, concessions, and patience.
Commentary written by Tina Tamboer, Senior Housing Analyst with The Cromford Report
©2022 Cromford Associates LLC and Tamboer Consulting LLC









