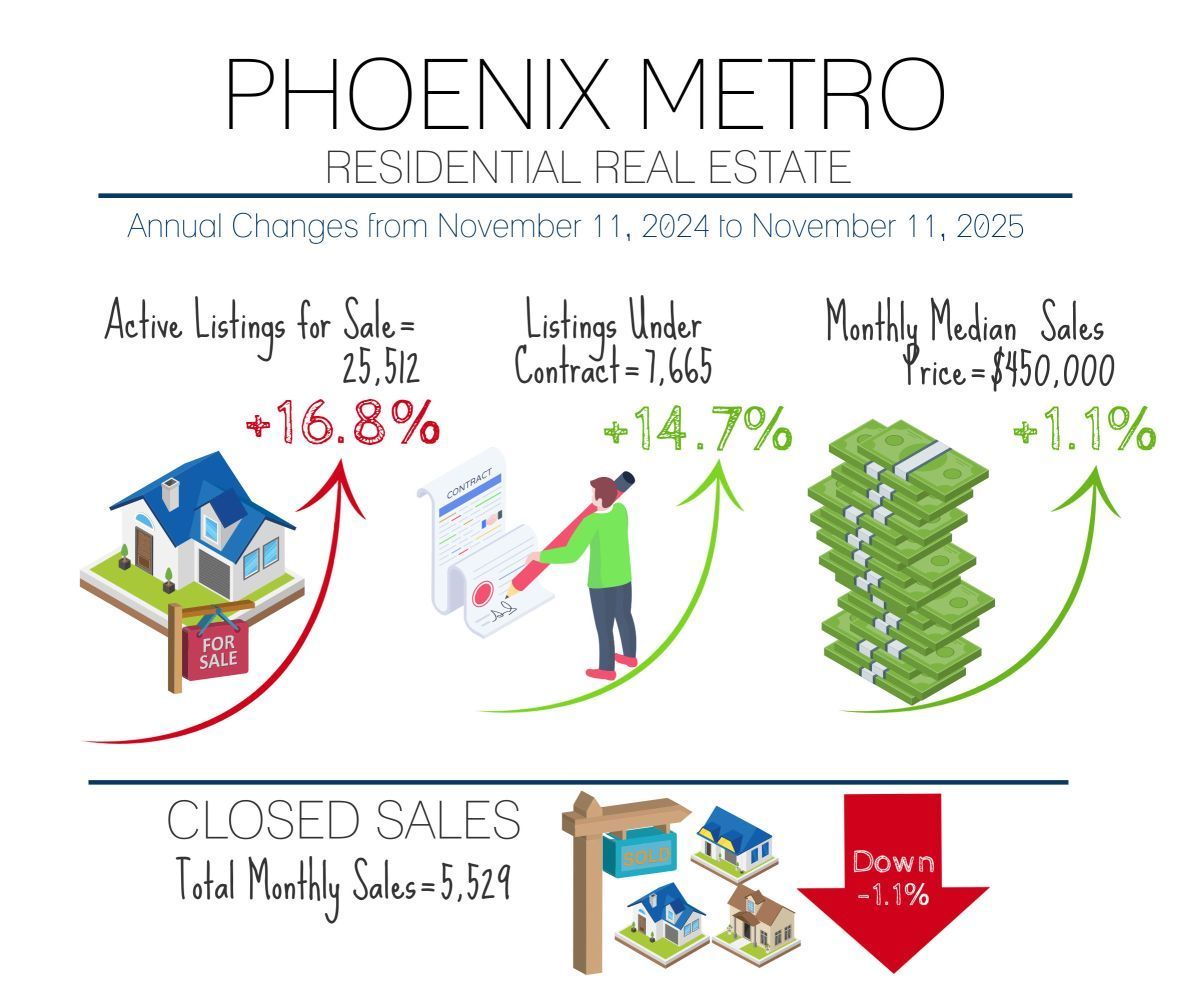
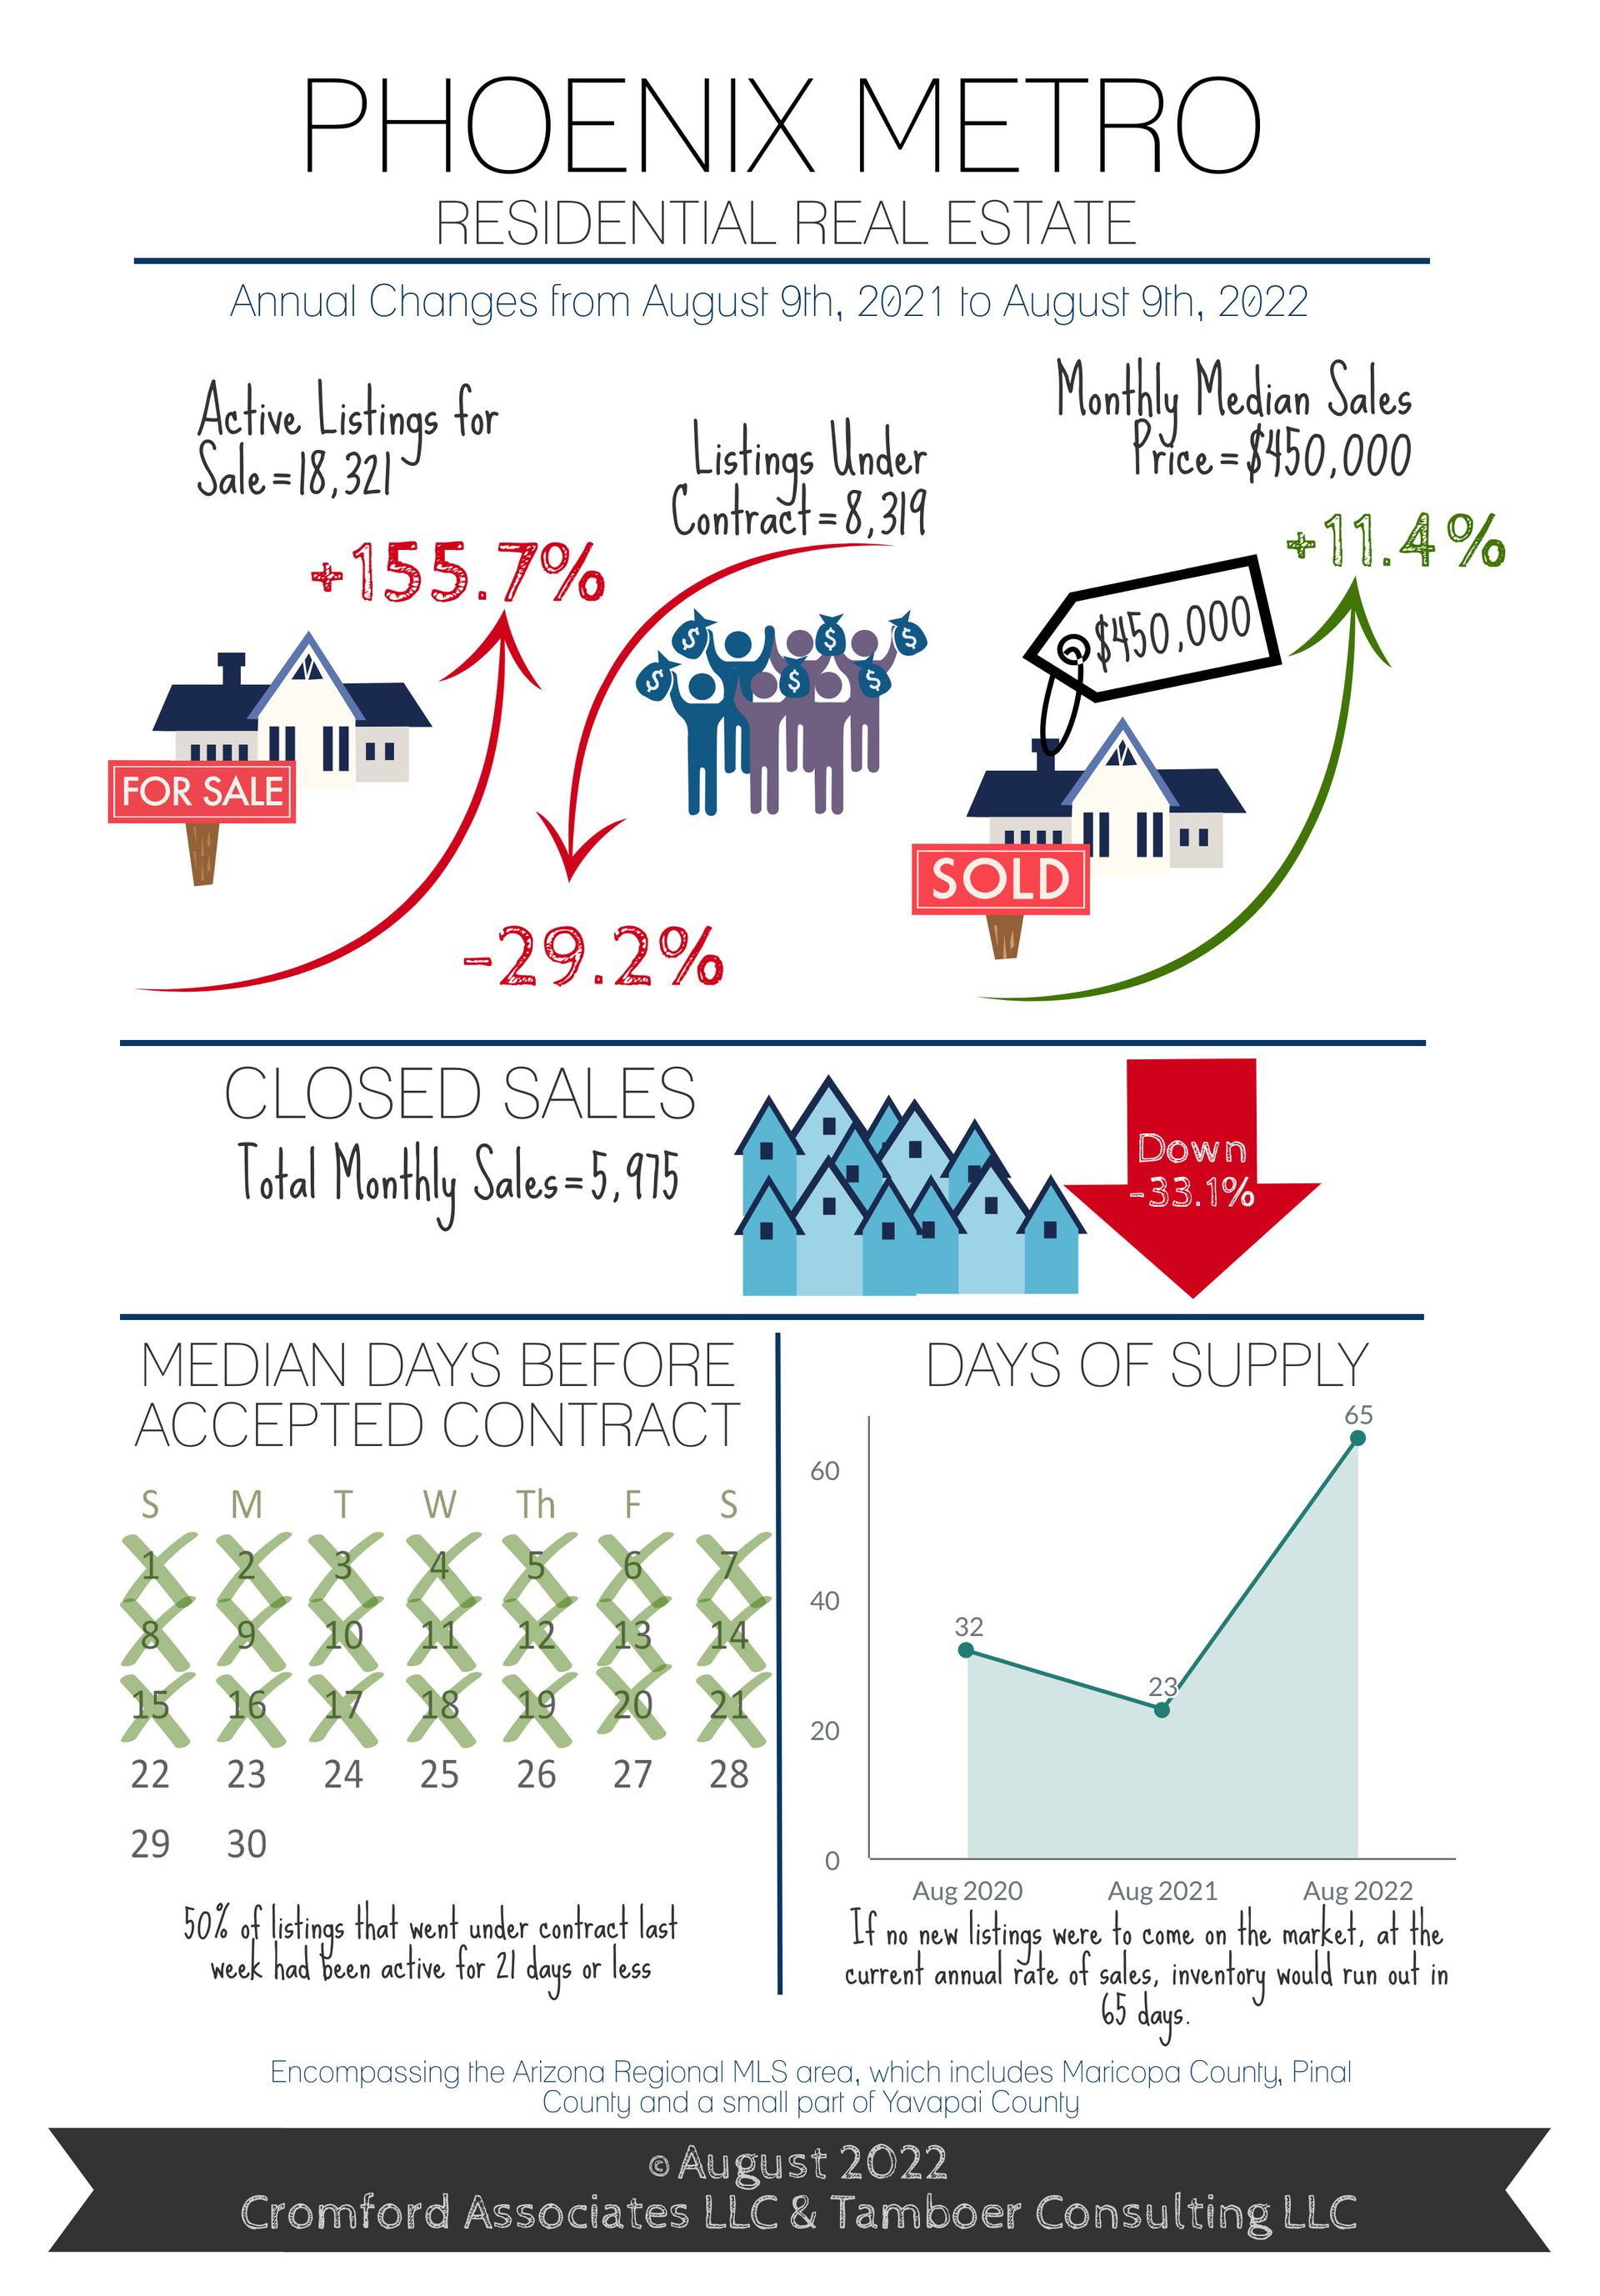
August 2022 Phoenix Real Estate Snapshot
Seller-Paid Closing Cost Assistance Coming Back; This Price Point is Declining the Fastest in Greater Phoenix
For Buyers:
Good news for buyers, the number of closings with seller-paid closing costs rose 27% in July compared to June equating to 7% of all closings for the month. That may not sound like much, but that’s the highest it’s been since March 2021.
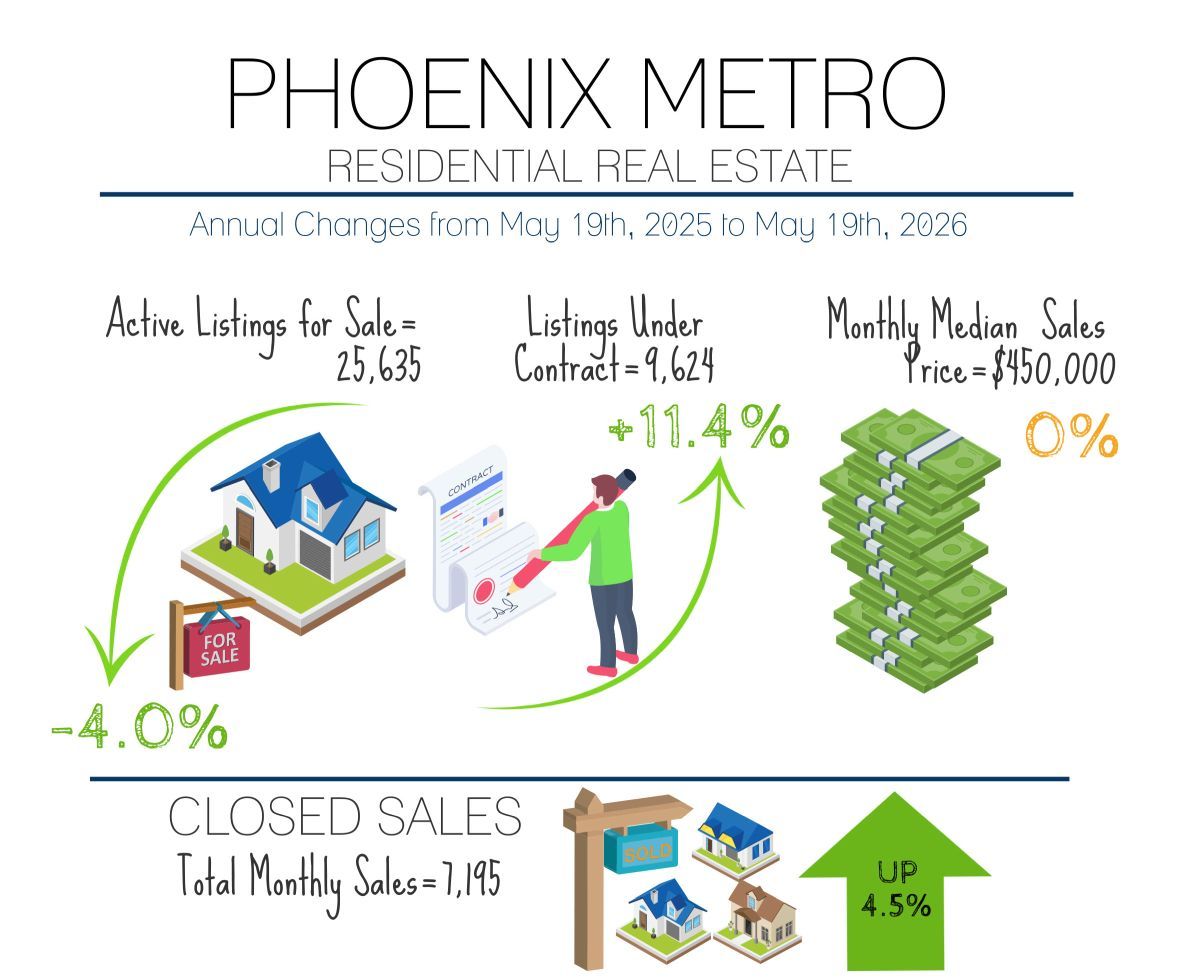
Prior to 2020, the established baseline for seller-paid closing cost assistance averaged 25-28% of MLS sales and over the past 15 months the average has been just 3-4.5%. The increase is expected to continue as large cash-based investors have pulled back their acquisitions, leaving many sellers to cater to normal buyers once again. For most of 2021 and the first part of 2022, buyers had very little time to decide on a property before it went under contract. Last May, half of all homes that went under contract were on the market for only 7 days or less. This month homes are on the market a median of 21 days prior to an accepted contract, giving buyers more breathing room for a second showing and less pressure to make a decision on the spot. More evidence of a growing buyer’s advantage, the percentage of properties closing over list price has declined from 58% in April to 24% August-to-date and continues to decline. The median amount over list has also declined from $20,000 to $7,000. As the current balanced market continues, expect to see this measure drop to just 10%-15% closing over list.
For Sellers:
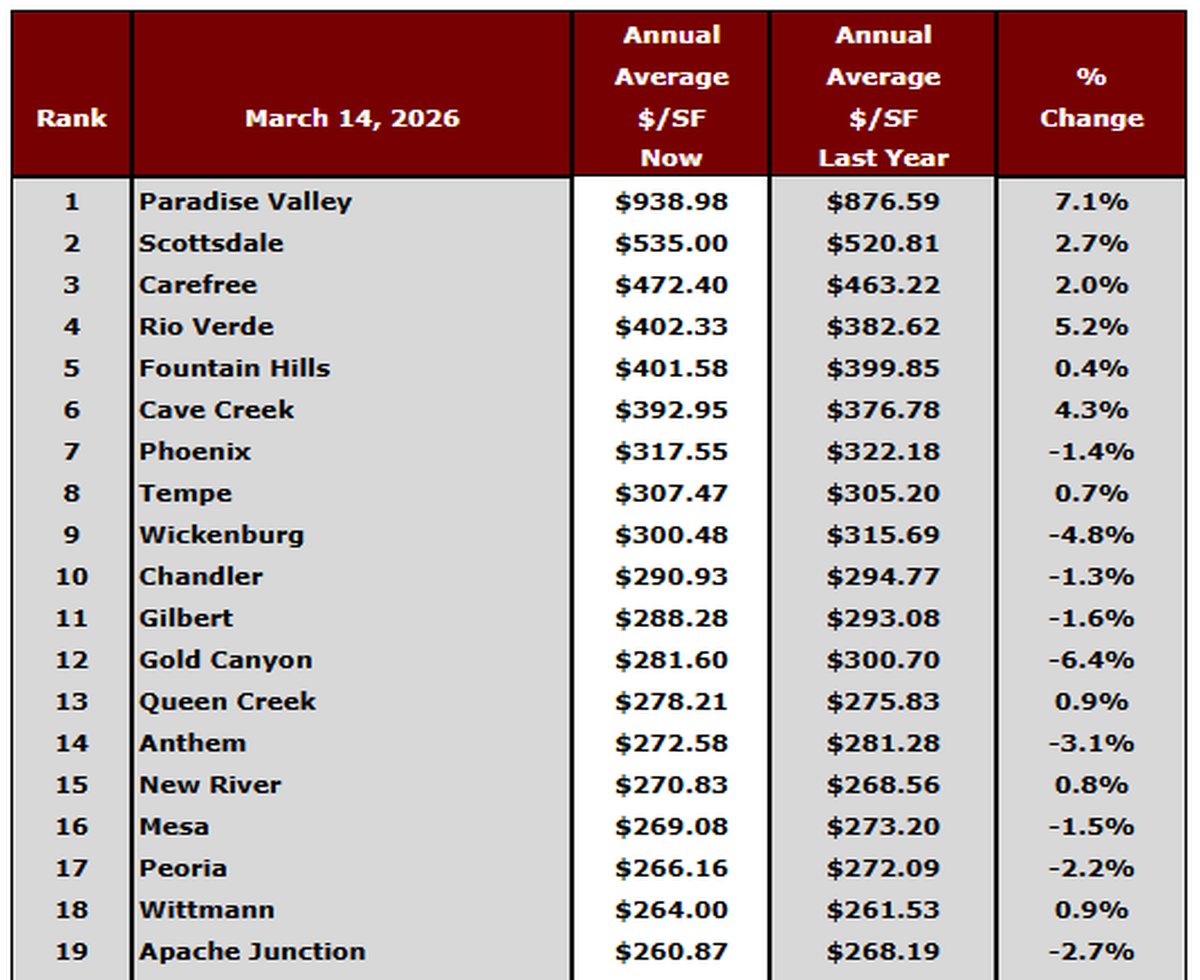
The last week in July saw 4,172 price reductions on Greater Phoenix listings, equating to 26% of active supply for that week. The median price reduction was $15,000 and 78% were over $5,000. The peak of price for 2022 so far was May, since then the median sales price has declined 6.25% from $480K to $450K. That’s an average of 2% per month thus far, however the downward trend has not been consistent across all price ranges; a detail not reflected in the median sale price measure. To analyze the price response by sales price range, we use the sales price per square foot. In May, the peak sales price per square foot overall was $305.99, August-to-date is $289.89, a 5.3% drop averaging 1.8% per month.
This is a similar result to the change in median sale price, but by price range the distribution looks like this:
Commentary written by Tina Tamboer, Senior Housing Analyst with The Cromford Report
©2022 Cromford Associates LLC and Tamboer Consulting LLC