
November 2022 Phoenix Real Estate Snapshot
One-by-One, Most Cities in Greater Phoenix Succumb to a Buyer’s Market; 44% of October Sales Involve Seller Paid Concessions to Buyer
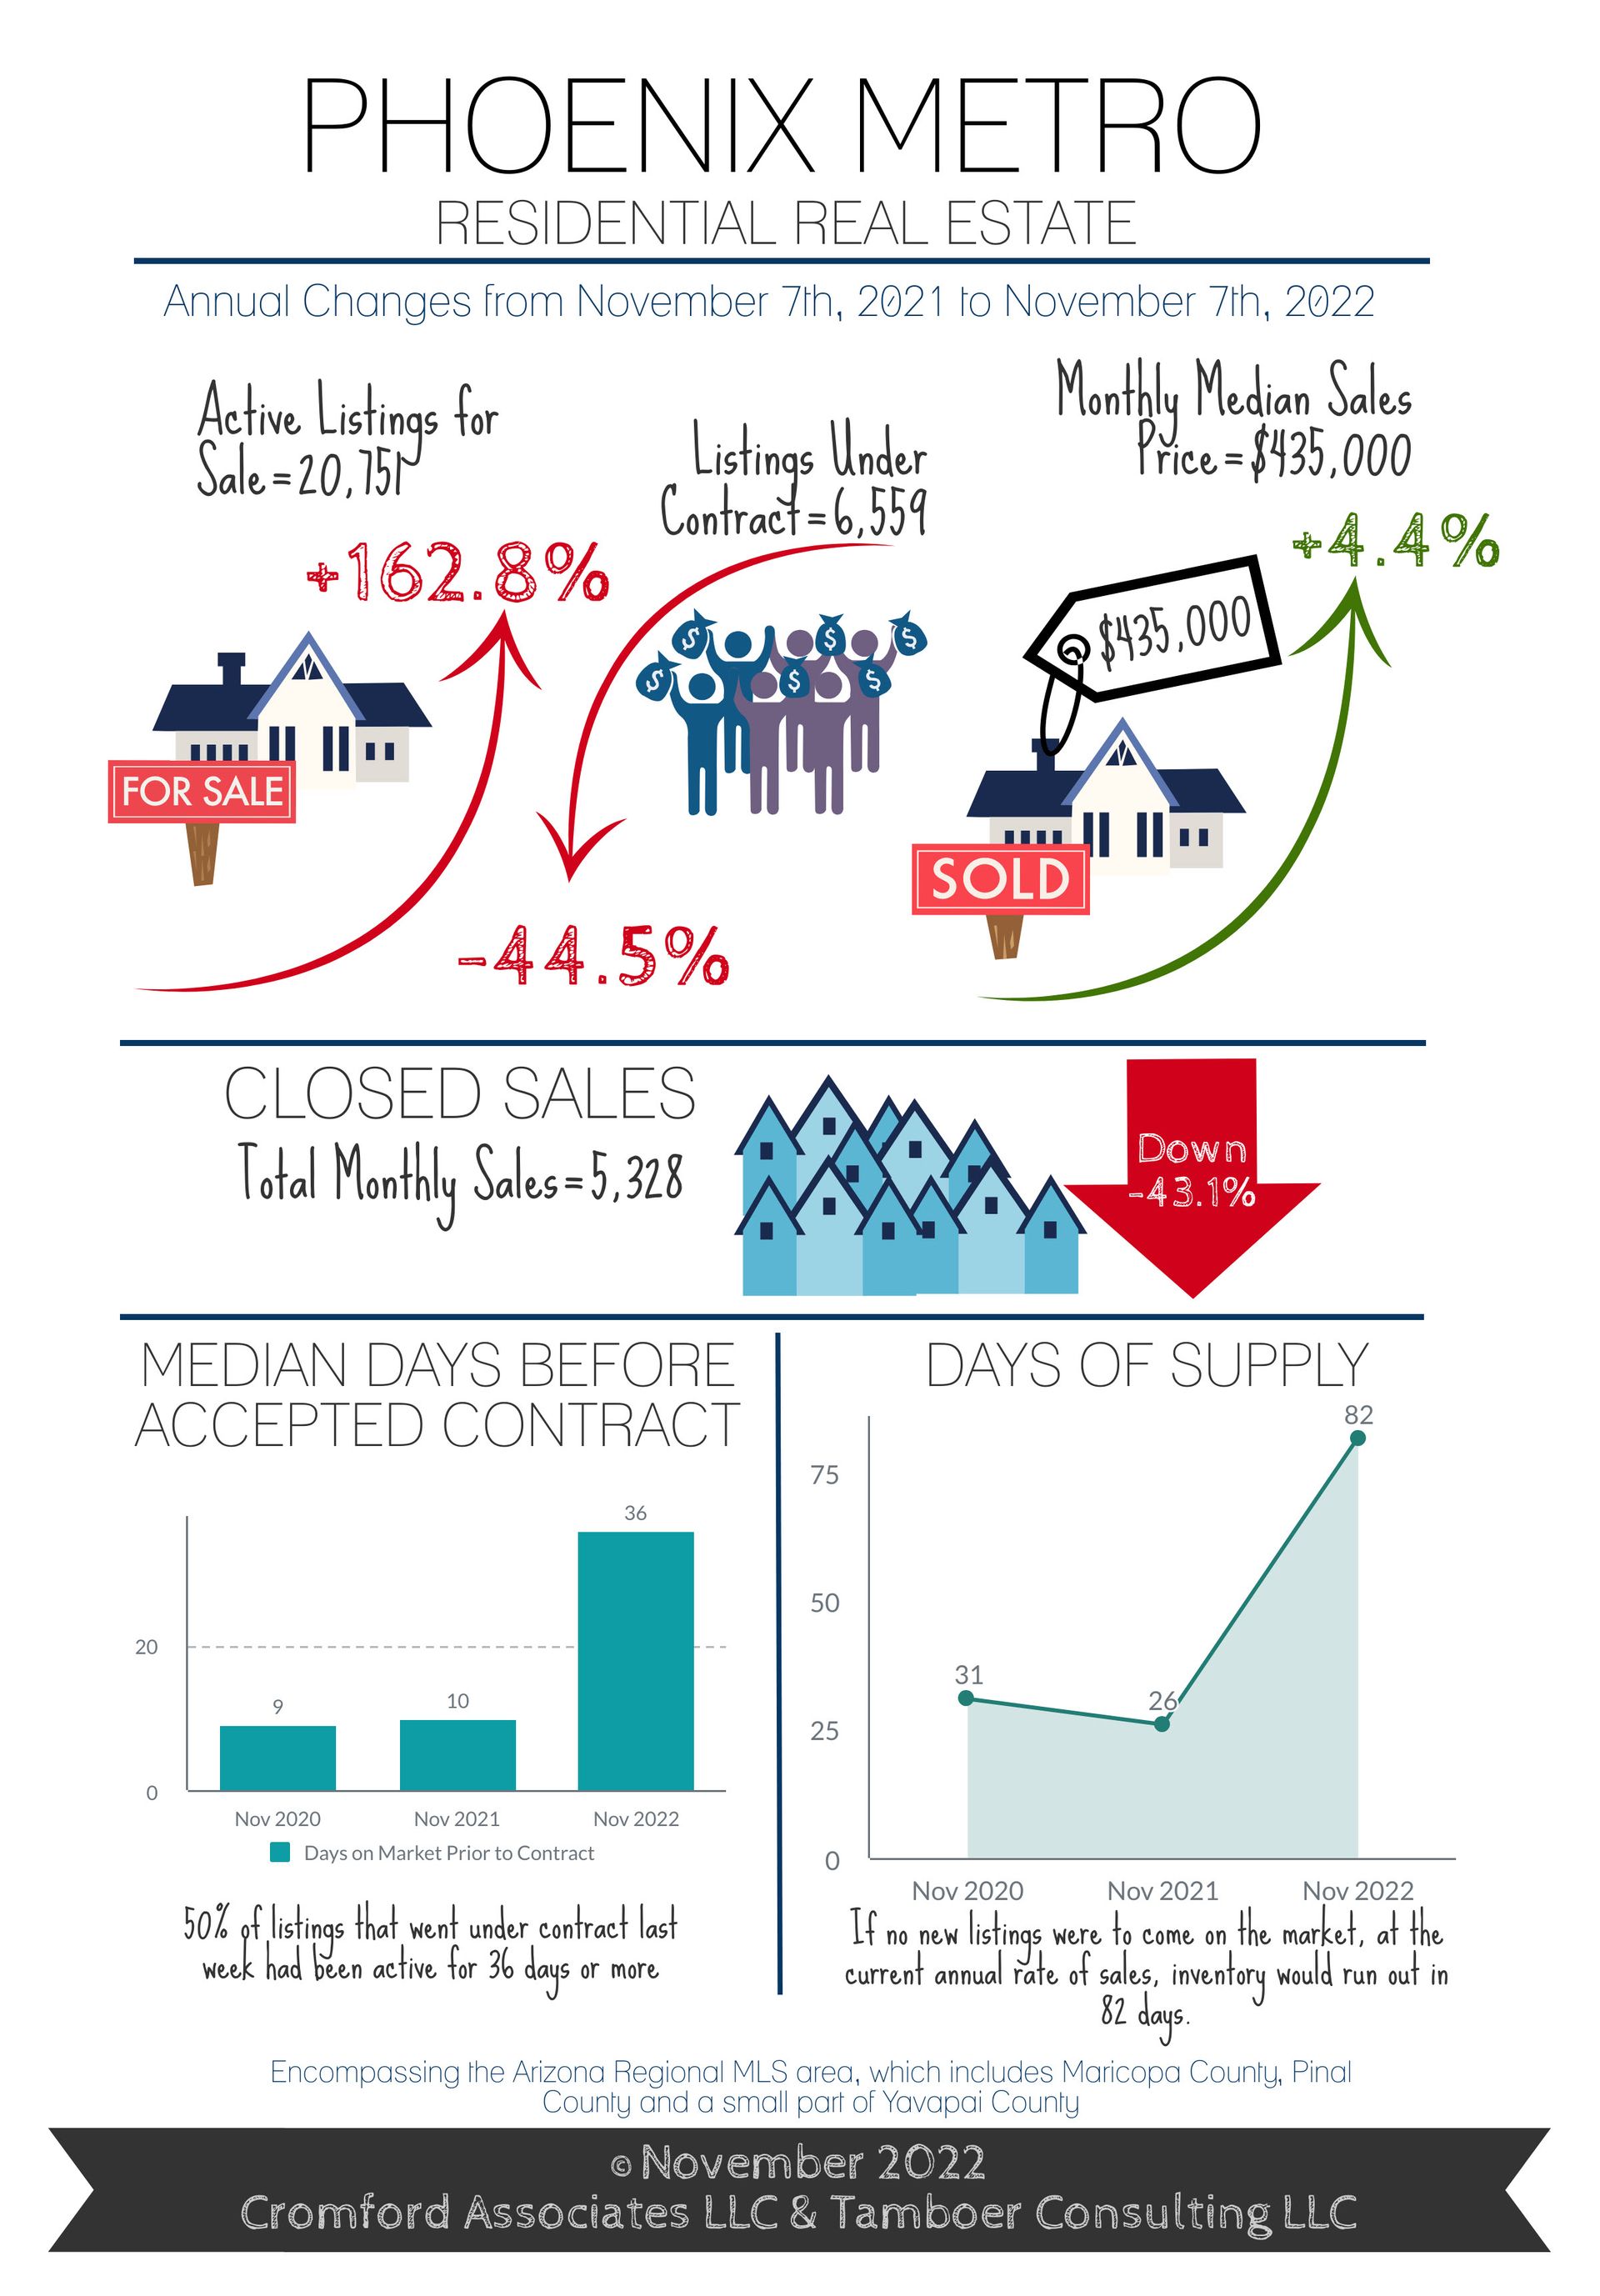
For Buyers:
Greater Phoenix as a whole has been in a balanced market since August, but is expected to glide into a buyer’s market by mid-November. Buckeye, Maricopa and Queen Creek entered a buyers market in July. Surprise, Chandler, Gilbert and Tempe followed in August. Goodyear, Peoria and Avondale joined in September with Mesa and Goodyear falling in line by October. Phoenix is expected to succumb this month within a matter of days. The only holdouts remain in the Northeast Valley cities of Paradise Valley, Fountain Hills, Cave Creek and Scottsdale.
The 2022 peak of price was achieved in May, which was the result of contracts accepted in late March and April. Starting in June, sales prices revealed their decline in response to mortgage rate increases. At the end of October, the decline in average sales price per square foot since May was recorded at -9.1%, but still positive year-over-year at +5.7%. The largest declines happened between June and July at -4.5% and between August and September at –3.6%.
Mortgage rates have stabilized between 7.0-7.3% for the past 6 weeks, all of October and November-to-date, and continue to keep buyer demand low for now. This provides an opportunity for buyers as more sellers agree to contributing to closing costs and rate buy-downs. October sales saw 44% of sales involve a seller contribution to the buyer at closing, with a median contribution of $7,400. Closings in the first week of November showed a median contribution of $9,000.
The tricky thing is that these seller-paid concessions are not recorded with the sales price. It’s common to see a buyer offer a higher price in exchange for closing cost assistance or a rate buy-down. This tactic can make the sales price measures appear to drop slower or even stabilize as the cost to the seller increases underneath that number on the settlement statement.
The flaw in waiting for the market to bottom out before purchasing is that no one knows they’re buying at the bottom when they buy there. The bottom, or top, of the market does not become apparent until 3-4 months after the contracts were written. By the time most buyers figure out that the market hit rock bottom, they’re too late to the party.
For Sellers:
While the environment has turned quickly away from a seller’s market to an impending buyer’s market, and the cost to sell has increased significantly for sellers, most are still walking away from the closing table with a profit.
While most reports are focused on short-term price drops since May, or smaller year-over-year appreciation rates, appreciation rates for homeowners who have owned their home for at least 2 years are still impressive. Approximately 65% of MLS listings, excluding new construction, have been owned for 2 years or more. Appreciation rates based on sales price per square foot through the MLS are: 2 years: +33.6%, 3 years: +59.9%, 4 years: +68.1%, 5 years: +84.8%.
Fewer sellers are opting to sell in this market. Since the tipping point in June, weekly accepted contracts have fallen 36%, counterbalanced with a 34% decline in weekly new listings. Historically, October typically adds about 10,000 new listings to supply, but this October was the lowest recorded at just 7,334 new actives plus 188 in Coming Soon status, a record low for the month. This has caused supply to stagnate over the past 4 weeks and is a small relief for existing sellers.
When supply self-regulates in response to lower demand, it puts less downward pressure on price. Not to say prices will not decline, they will, but it would be worse if supply were also rising. Contracts written in November and December will close in January and February next year. As Greater Phoenix glides into a buyer’s market this month, year-over-year appreciation rates are likely to turn negative in 2023.
Generally speaking, neither sellers nor buyers prefer to engage in real estate during times of uncertainty. Dramatic fluctuations in mortgage rates combined with insecurities surrounding inflation and unemployment have pressed pause on housing decisions for many sellers and buyers alike, for now. If mortgage rates drop, they’ll get off the fence.
Commentary written by Tina Tamboer, Senior Housing Analyst with The Cromford Report
©2022 Cromford Associates LLC and Tamboer Consulting LLC









