
May 2022 Phoenix Real Estate Snapshot
MLS Supply Up 45% in 6 Weeks; Rising Interest Rates Dropping Demand Quickly
For Buyers:
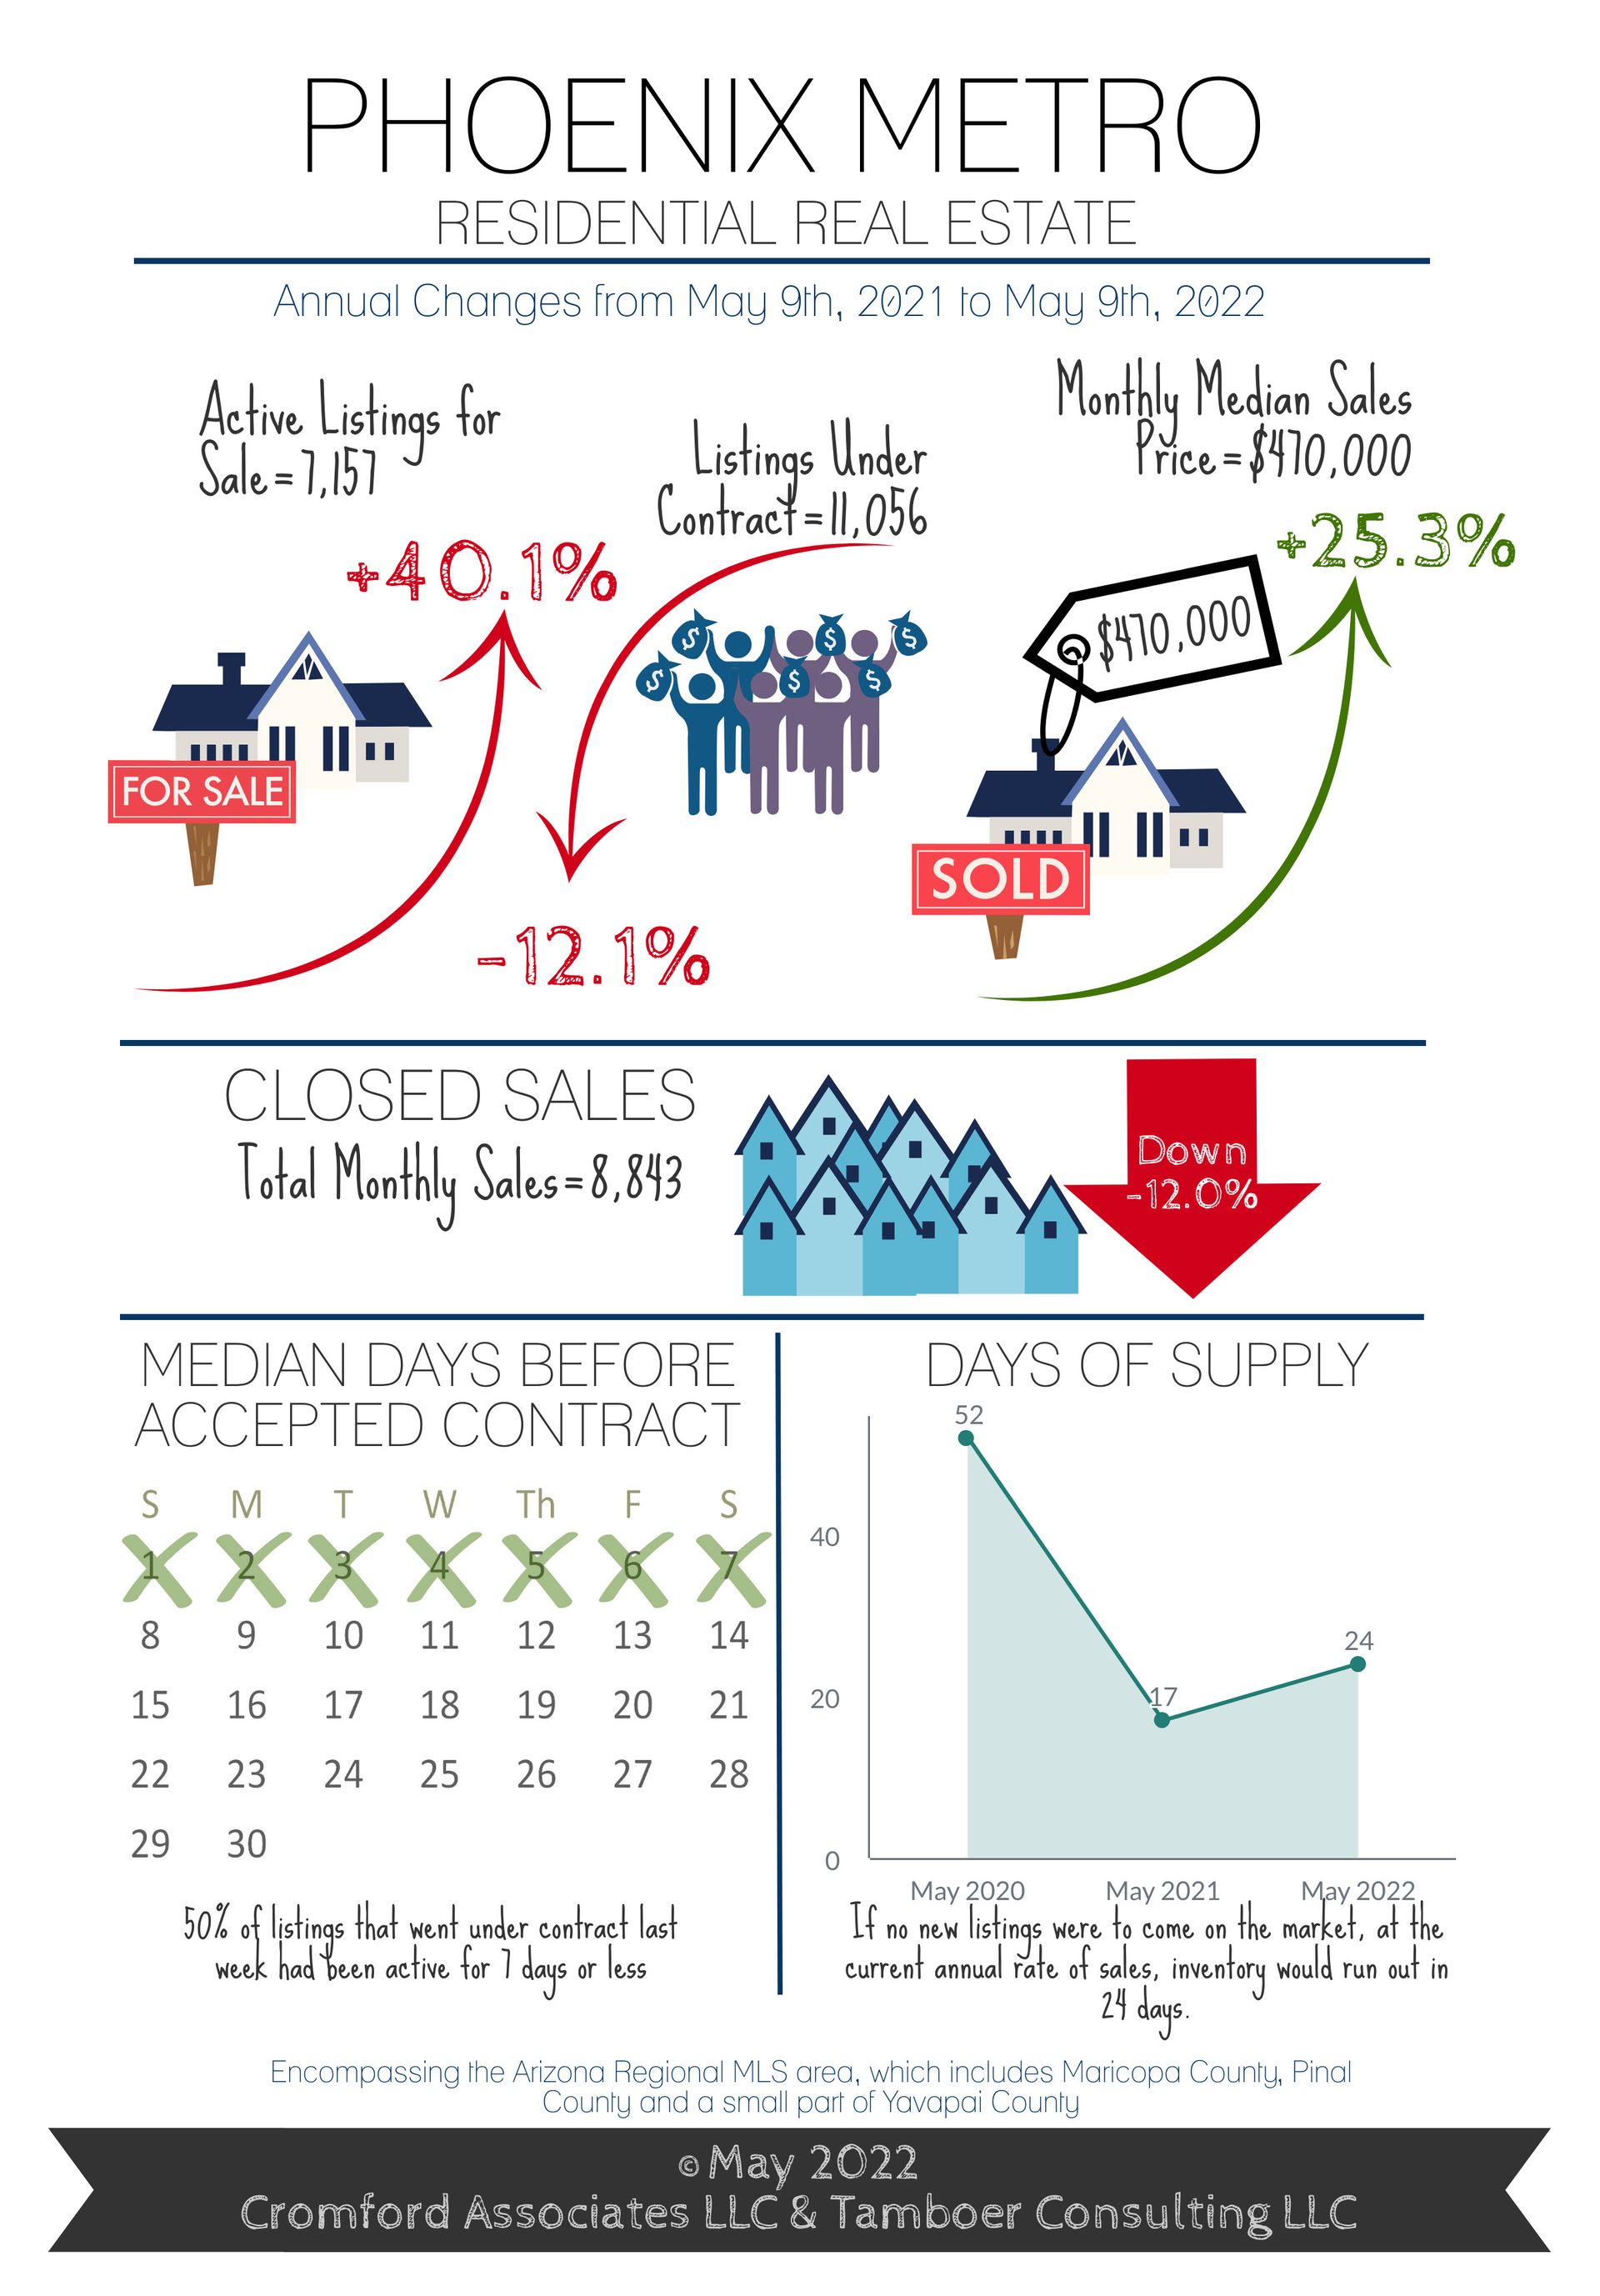
It’s the moment you’ve been waiting for, less competition and more supply in Greater Phoenix! Active supply is up 40% from this time last year, but all that gain has been achieved over the last 6 weeks with an increase of 45%. This is an enormous change from April’s report where supply was only up 16% over last year and still below the count reported on January 1st. As of this report, the supply count is 7,157, still 72% below normal for this time of year but rising quickly.
The annual change in inventory is impressive, but it’s the short-term growth that is sending shock waves throughout the market. Inventory listed between $400K-$500K is up 35% in just 3 weeks. Counts in all segments between $500K-$1M are up 99% in 6 weeks and the count from $1M-$1.5M is up 54%, also within 6 weeks. Not all price ranges are rising in inventory. Properties listed below $400K are still flying off the shelves and declining in supply.
The increase in inventory may seem like an early Christmas miracle, but it’s not coming from a massive flood of new listings hitting the market. Visualize supply counts as the level of water in a bathtub, with new listings coming through the faucet and accepted contracts going down the drain. The water level can rise if there are more new listings coming through the faucet, or if there are fewer accepted contract flowing down the drain. In this case, new listings are at normal levels and not excessive, but fast rising mortgage rates have reduced the number of accepted contracts and closed the drain. This is what is causing inventory in the “bathtub” to increase dramatically.
While recent interest rates are disappointing for many buyers, causing some to drop out and wait, history has shown us that they rarely stay high, or low, forever. While it’s near impossible to predict when interest rates may begin to decline, if we look over the last decade when interest rates have risen by 1% or more within a year, it has taken anywhere from 1 to 3 years for them to return to their original starting point. Even when rates increased by a whopping 5% over 14 months from 1980-1981, it only took 1.5yrs to drop back to where they started. Future expected interest rate drops over the next few years along with moderate home price appreciation and monthly principal reductions may provide today’s buyers the opportunity to lower their payments by hundreds of dollars down the road.
For Sellers:
The market is in the early stage of shifting out of an insane seller market and into a mere frenzy seller market. Before we know it, it could be a regular old hot seller market where properties still appreciate but take multiple weeks to sell, buyers don’t waive their appraisal contingency, and sellers happily pay for home warranties. But before all of that happens, it starts with one simple act from a seller, a list price reduction.
As inventory has risen at a fast pace over the past 6 weeks, so have the number of weekly price reductions as sellers compete for fewer buyers. Listings between $400K-$500K have seen a 103% increase, with the median price drop at $13,000. Price drops in $500K-$800K range increased 157%, with median drops between $16,000 and $20,000. Drops in the $800K-1.5M range increased 125%, with a median drop between $25,000 to $50,000.
So far, price reductions have proven effective in keeping the median days prior to contract around 7 days. However, as inventory continues to rise in the coming weeks, price reductions may not be enough to keep some properties from lingering longer in active status, creating more choice for buyers and strengthening their bargaining power.
While the market is still strongly in favor of sellers, it is changing rapidly. For those sellers waiting to sell close the peak of price, this may be the time to list. Prices are still projected to continue rising, but at a slower pace over the next few months.
Commentary written by Tina Tamboer, Senior Housing Analyst with The Cromford Report
©2022 Cromford Associates LLC and Tamboer Consulting LLC









