
June 2022 Phoenix Real Estate Snapshot
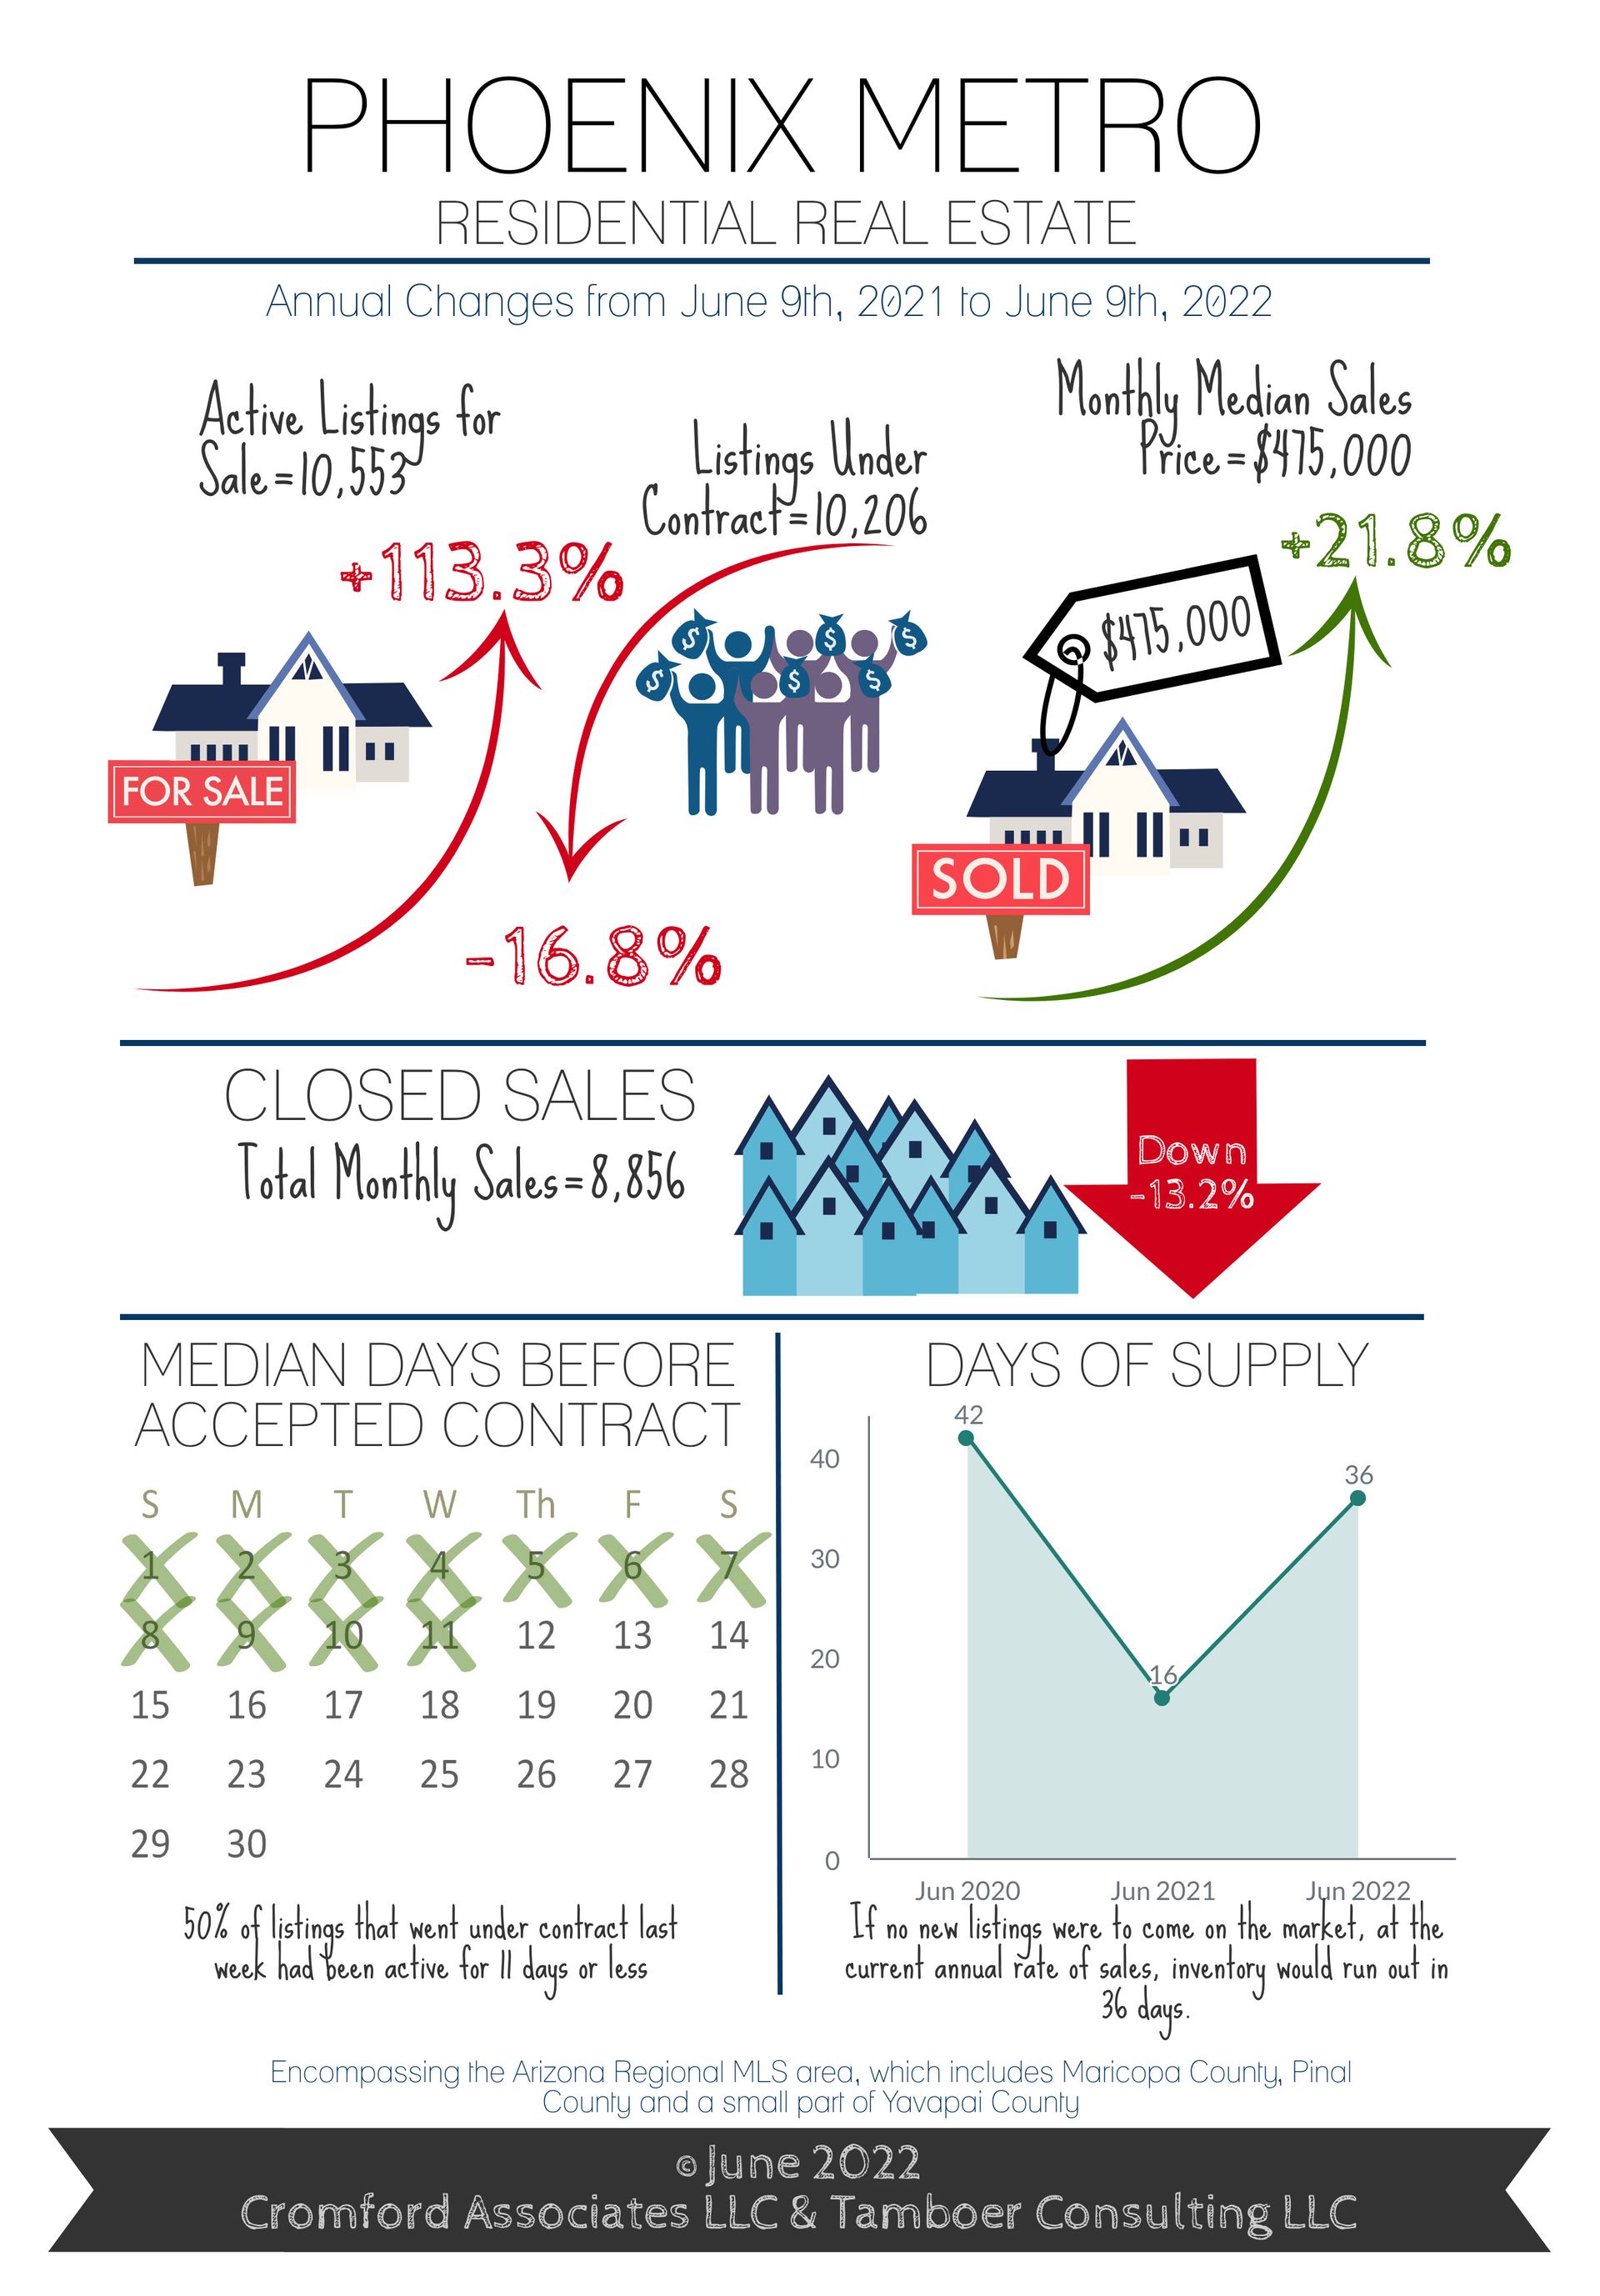
MLS Supply Up 113% Over Last Year; Median Days Prior to Contract Rising
For Buyers:
Market conditions continue to get better for buyers undeterred by rising mortgage rates. Over the last 10 weeks, there has been a surge of new listings in every price point over $400K, pushing the supply level up 113% over this time last year. The surge in new listings is not happening under $400K, however rising interest rates have caused demand in this price range to decline. As a result, supply is rising on the low-end due to buyers pulling back, not excessive new listings.
In a nutshell, when sellers have to compete, buyers win. What they win at this stage is their sanity and some normalcy in the home buying process. By normalcy, typical contract requirements such as appraisal and inspection contingencies remain in place. There may be multiple properties available that fit a buyer’s needs, instead of only one with multiple offers already submitted. The median number of days prior to contract is now 11, up 4 days from last month, which provides more breathing room for scheduling showings.
For some buyers, this moment is bittersweet because it comes with higher mortgage rates. However, interest rates typically do not stay high, or low, forever. The Mortgage Bankers Association expects mortgage rates to decline to 4.4% by 2024. How does that play out for someone who buys a home today? Let’s look.
Current rates at 5.2% place the estimated principal and interest payment for a $425,000 loan at approximately $2,335 per month. Fast forward to the future, the remaining mortgage balance after just 2 years of payments would be $413,000. Hypothetically, if interest rates are 4.4% by this point, a refinance of the remaining balance would lower the payment to $2,068, saving $267 per month.
If a potential home buyer instead decides to wait 2 years for the interest rates to decline to 4.4% before purchasing, assuming home prices stay exactly the same, their PI payment on a $425,000 loan would be $2,128, only saving $207.
The problem with waiting for the perfect time to purchase a home is that most people don’t realize the timing is perfect at the time it’s actually perfect. For this reason, planning to hold property long term is the best way to mitigate short term risk and take advantage of refinance opportunities as they come, continually building equity regardless of what the market is doing.
For Sellers:
As competing supply continues to rise sharply, certain sales measures are expected to start changing rapidly. One of the most dramatic measures is the percentage of closings over list price and the median dollar amount over asking price.
April 2022 saw 58% of sales close over asking price with a median of $20,000 over. So far, closings in June show 51% closing over asking price with a median of $15,000 over. Even in weaker seller markets, excellent properties well priced receive multiple offers and sell over asking price. The difference is that they typically only make up about 15% of sales with a median of $3,000 over. So the market isn’t back to normal yet, but it’s rapidly moving in that direction.
Price reductions are now up 258% in 10 weeks, but just over the past 5 weeks the days on market prior to contract has started to rise as well. Over the next 4 weeks, expect the number of closings over asking price to drop sharply along with the dollar amount and expect to be reintroduced to buyer contingencies, price negotiations, paying for home warranties and eventually closing cost assistance. These aspects will return to the marketplace before sale prices ultimately respond.
This isn’t a buyer market, but for some it feels like it is compared to just 2-3 months ago.
Commentary written by Tina Tamboer, Senior Housing Analyst with The Cromford Report
©2022 Cromford Associates LLC and Tamboer Consulting LLC









