
April 2022 Phoenix Real Estate Snapshot
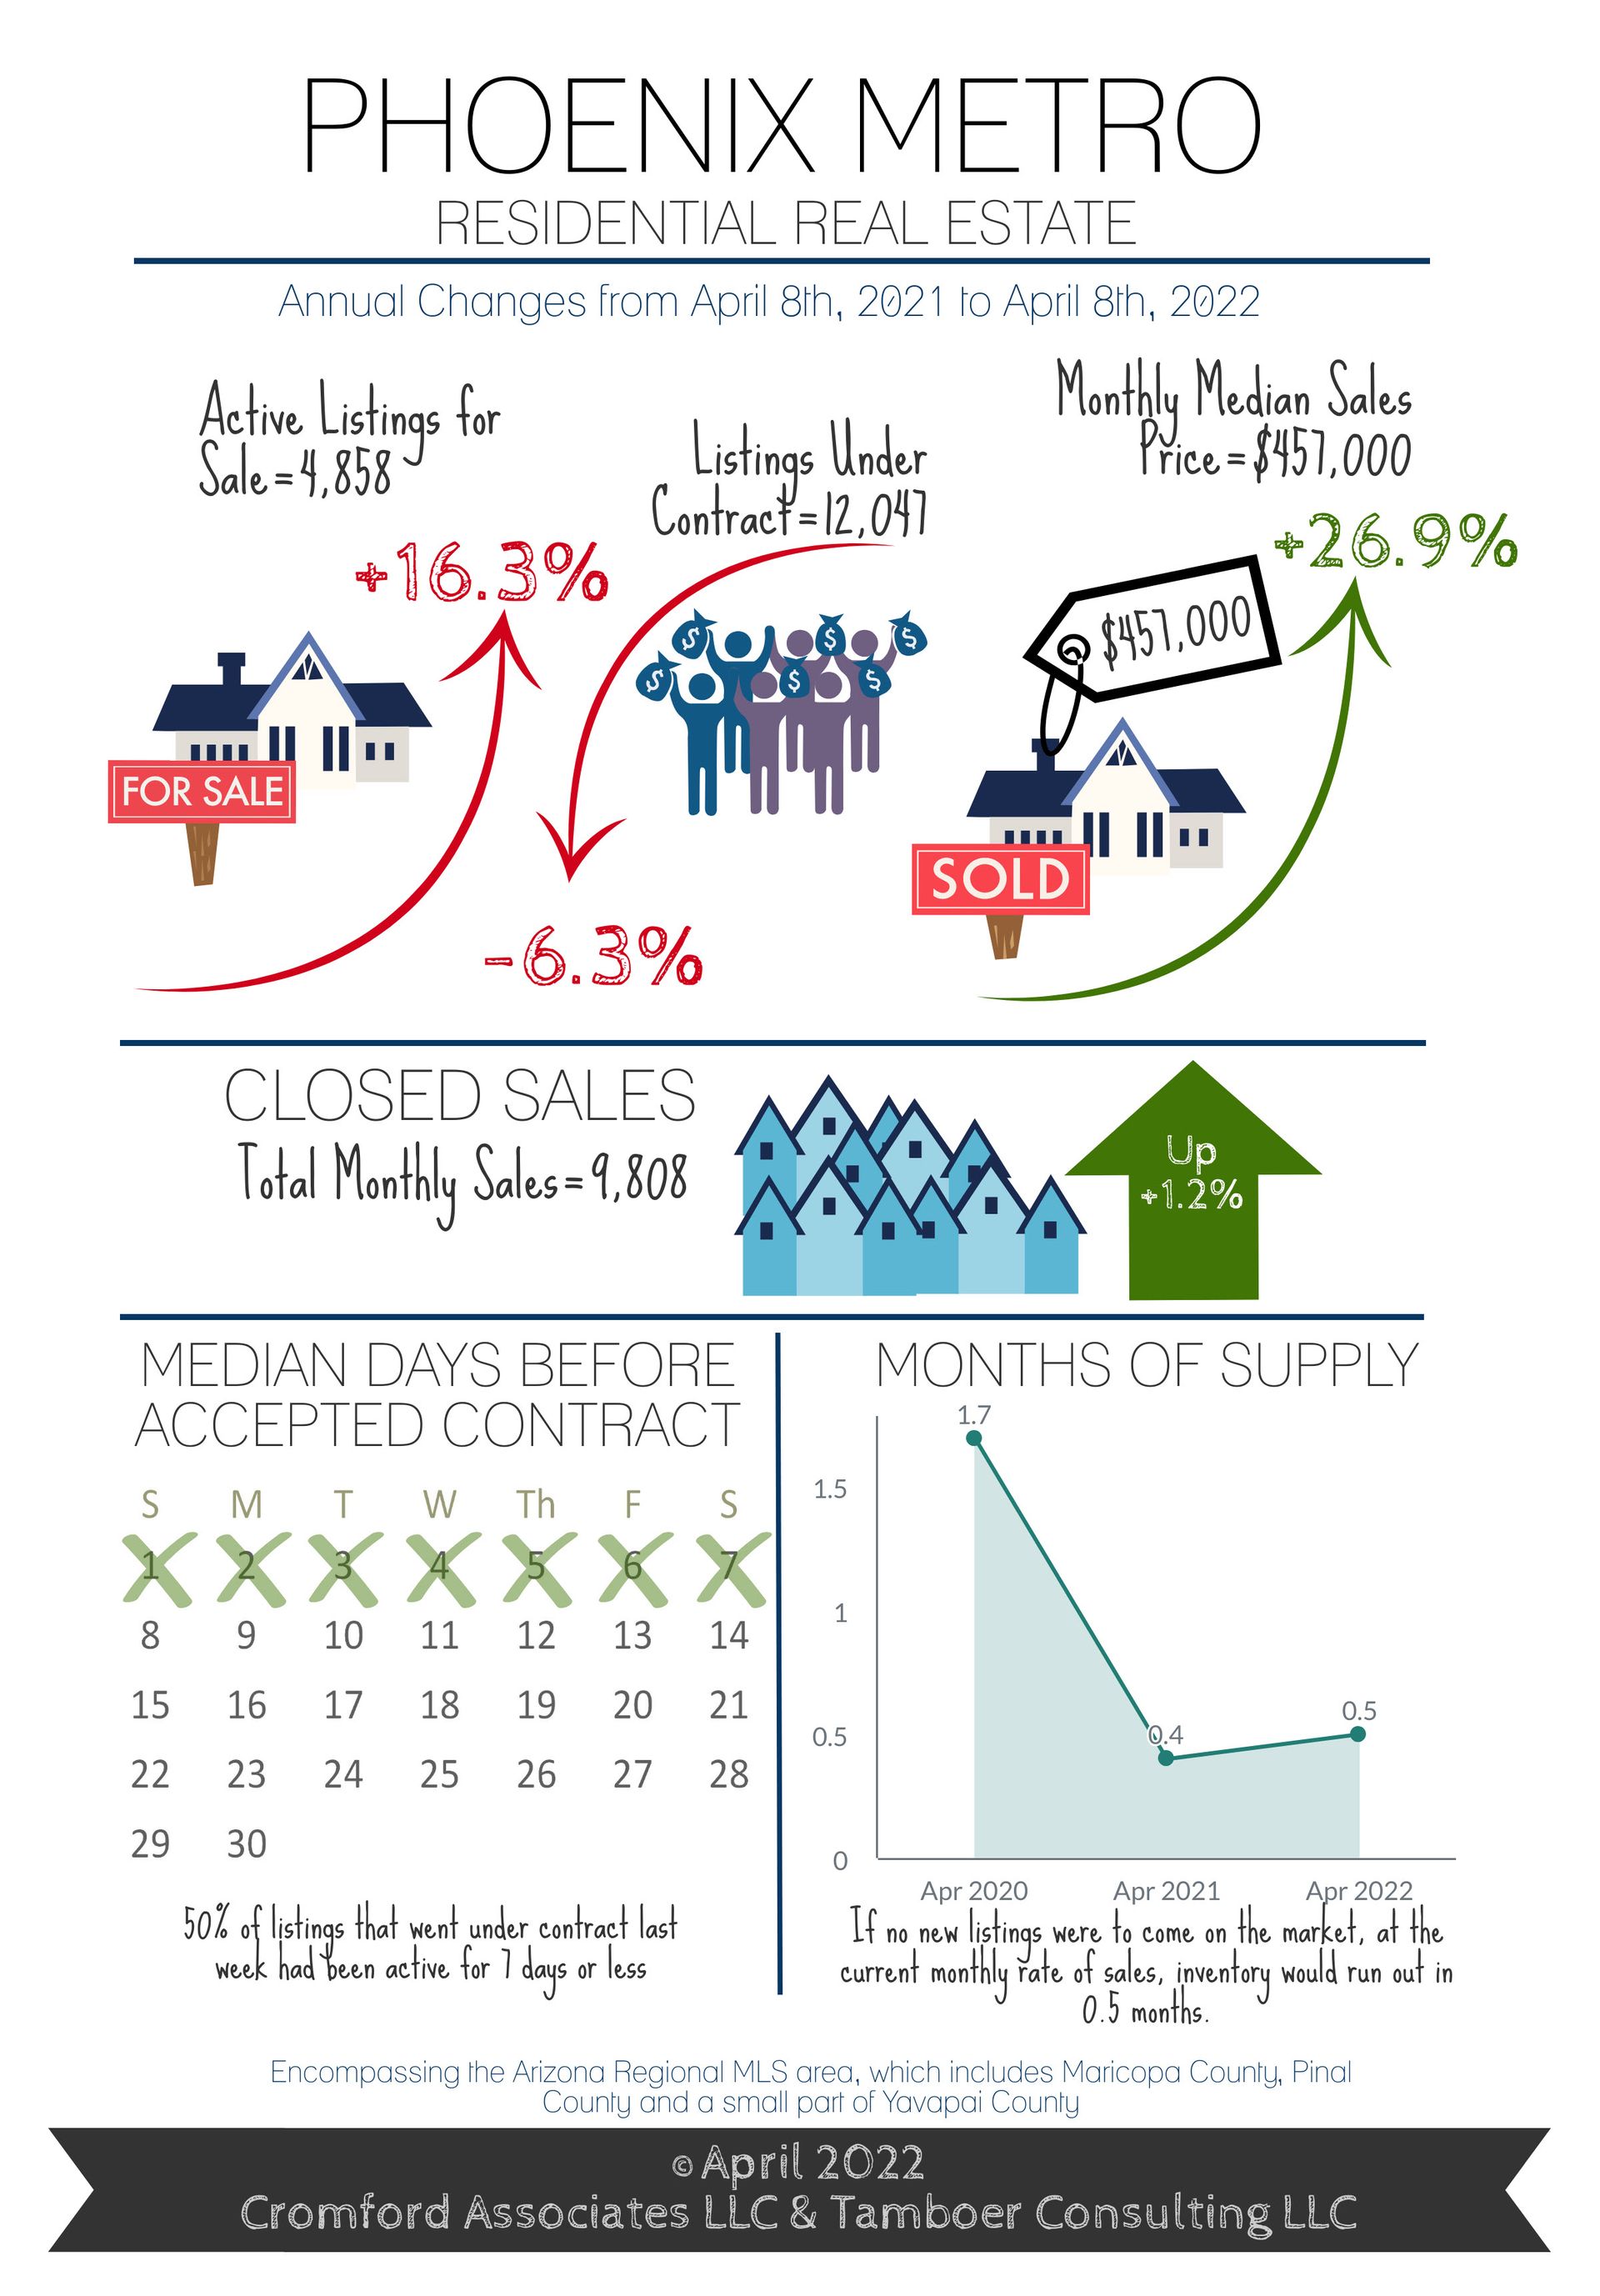
57% of Sales are Over Asking Price; Median Sale Price Up 27% to $457,000
For Buyers:
Supply is still the top concern for buyers these days and we continue to look to new construction to add new homes and ease the pressure on price. The top areas for new single family home sales are the West Valley, with 44% market share, and Pinal County, with 27% market share. The Southeast Valley comes in 3rd with 17%. If you’re looking to the West Valley for a new home, your best bets are Laveen, just east of the new 202 freeway loop, and cities just west of the 303 freeway such as Peoria, Surprise, Waddell, Goodyear and Buckeye. In the Southeast Valley, new home subdivisions are concentrated in East Mesa, Queen Creek, South Gilbert and South Chandler. In Pinal County, Casa Grande and Maricopa have the most new home sales.
As of February 2022, the median cost of a new home closed was $447,000 overall with a median size of 2,197 sq. ft. That was just under the resale median of $450,000 in the same month, which had a median size of 1,783 sq. ft. In the West Valley, the new home median is $443,000 with 2,237 sq. ft. In the Southeast Valley that median is $579,000 and 2,456 sq. ft., and in Pinal County it is $385,000 with 1,888 sq. ft.
New home developers continue to struggle with a labor shortage and supply chain issues. It’s not uncommon for builders to estimate 14-16 months before completion of a home. Because prices have been rising sharply, this means that by the time a home is built, the costs to complete it have gone up and it’s already worth significantly more than the negotiated purchase price. For this reason, some builders are including escalation clauses in their contracts that allow them to raise the price prior to close of escrow to accommodate the higher costs to build and closer reflect the current market value. In addition to escalation clauses, a handful of builders are including restrictions on when a homeowner can sell or rent the home after close. It’s important to read builder contracts closely and ensure you understand every section before moving forward.
For Sellers:
The market continues to heavily favor sellers. Supply is still 76% below normal for this time of year and demand is 6% above normal. However, demand is declining in response to recent increases in interest rates. Just 30 days ago, demand was 12% above normal, and 30 days prior to that it was 21% above normal. Buyers across the nation are in the best financial shape seen in decades with an average credit score of 714 last year, according to Experian, and Maricopa County has the lowest percentage of consumers with credit scores below 660 in at least 22 years. However, in just a few short months, the average interest rate increased from 3.1% in December to 4.7% by April. This resulted in a $500 increase in the estimated payment on a 1,500-2,000 sq. ft. home, pushing the cost to buy significantly higher than the cost to rent in Greater Phoenix.
This does not mean the market is at its peak, or at the precipice of a price decline. The only response we are seeing at this time is a sharp increase in supply between $500K-$1M over the past 2 weeks, a price range that happens to have less interest from investors and 2nd home owners and a higher market share of owner-occupants. Despite this increase in supply, the median days on market prior to contract is still only 7 days, and there aren’t any bold movements in price reductions or seller concessions. Until we see an upward shift in price reductions and seller concessions, we will not see a flattening out or decline in sale prices.
Currently, April closings to date have seen 57% of closings over asking price and a 22% appreciation rate compared to April 2021 thus far. While it’s reasonable to expect price appreciation to slow down at some point, there is little evidence at this stage to show prices declining in the near future.
Commentary written by Tina Tamboer, Senior Housing Analyst with The Cromford Report
©2022 Cromford Associates LLC and Tamboer Consulting LLC









