
March 2022 Phoenix Real Estate Snapshot
Short Term Rentals up 23% NE Valley; MLS Rental Supply up 60% in 5 Months
For Buyers:
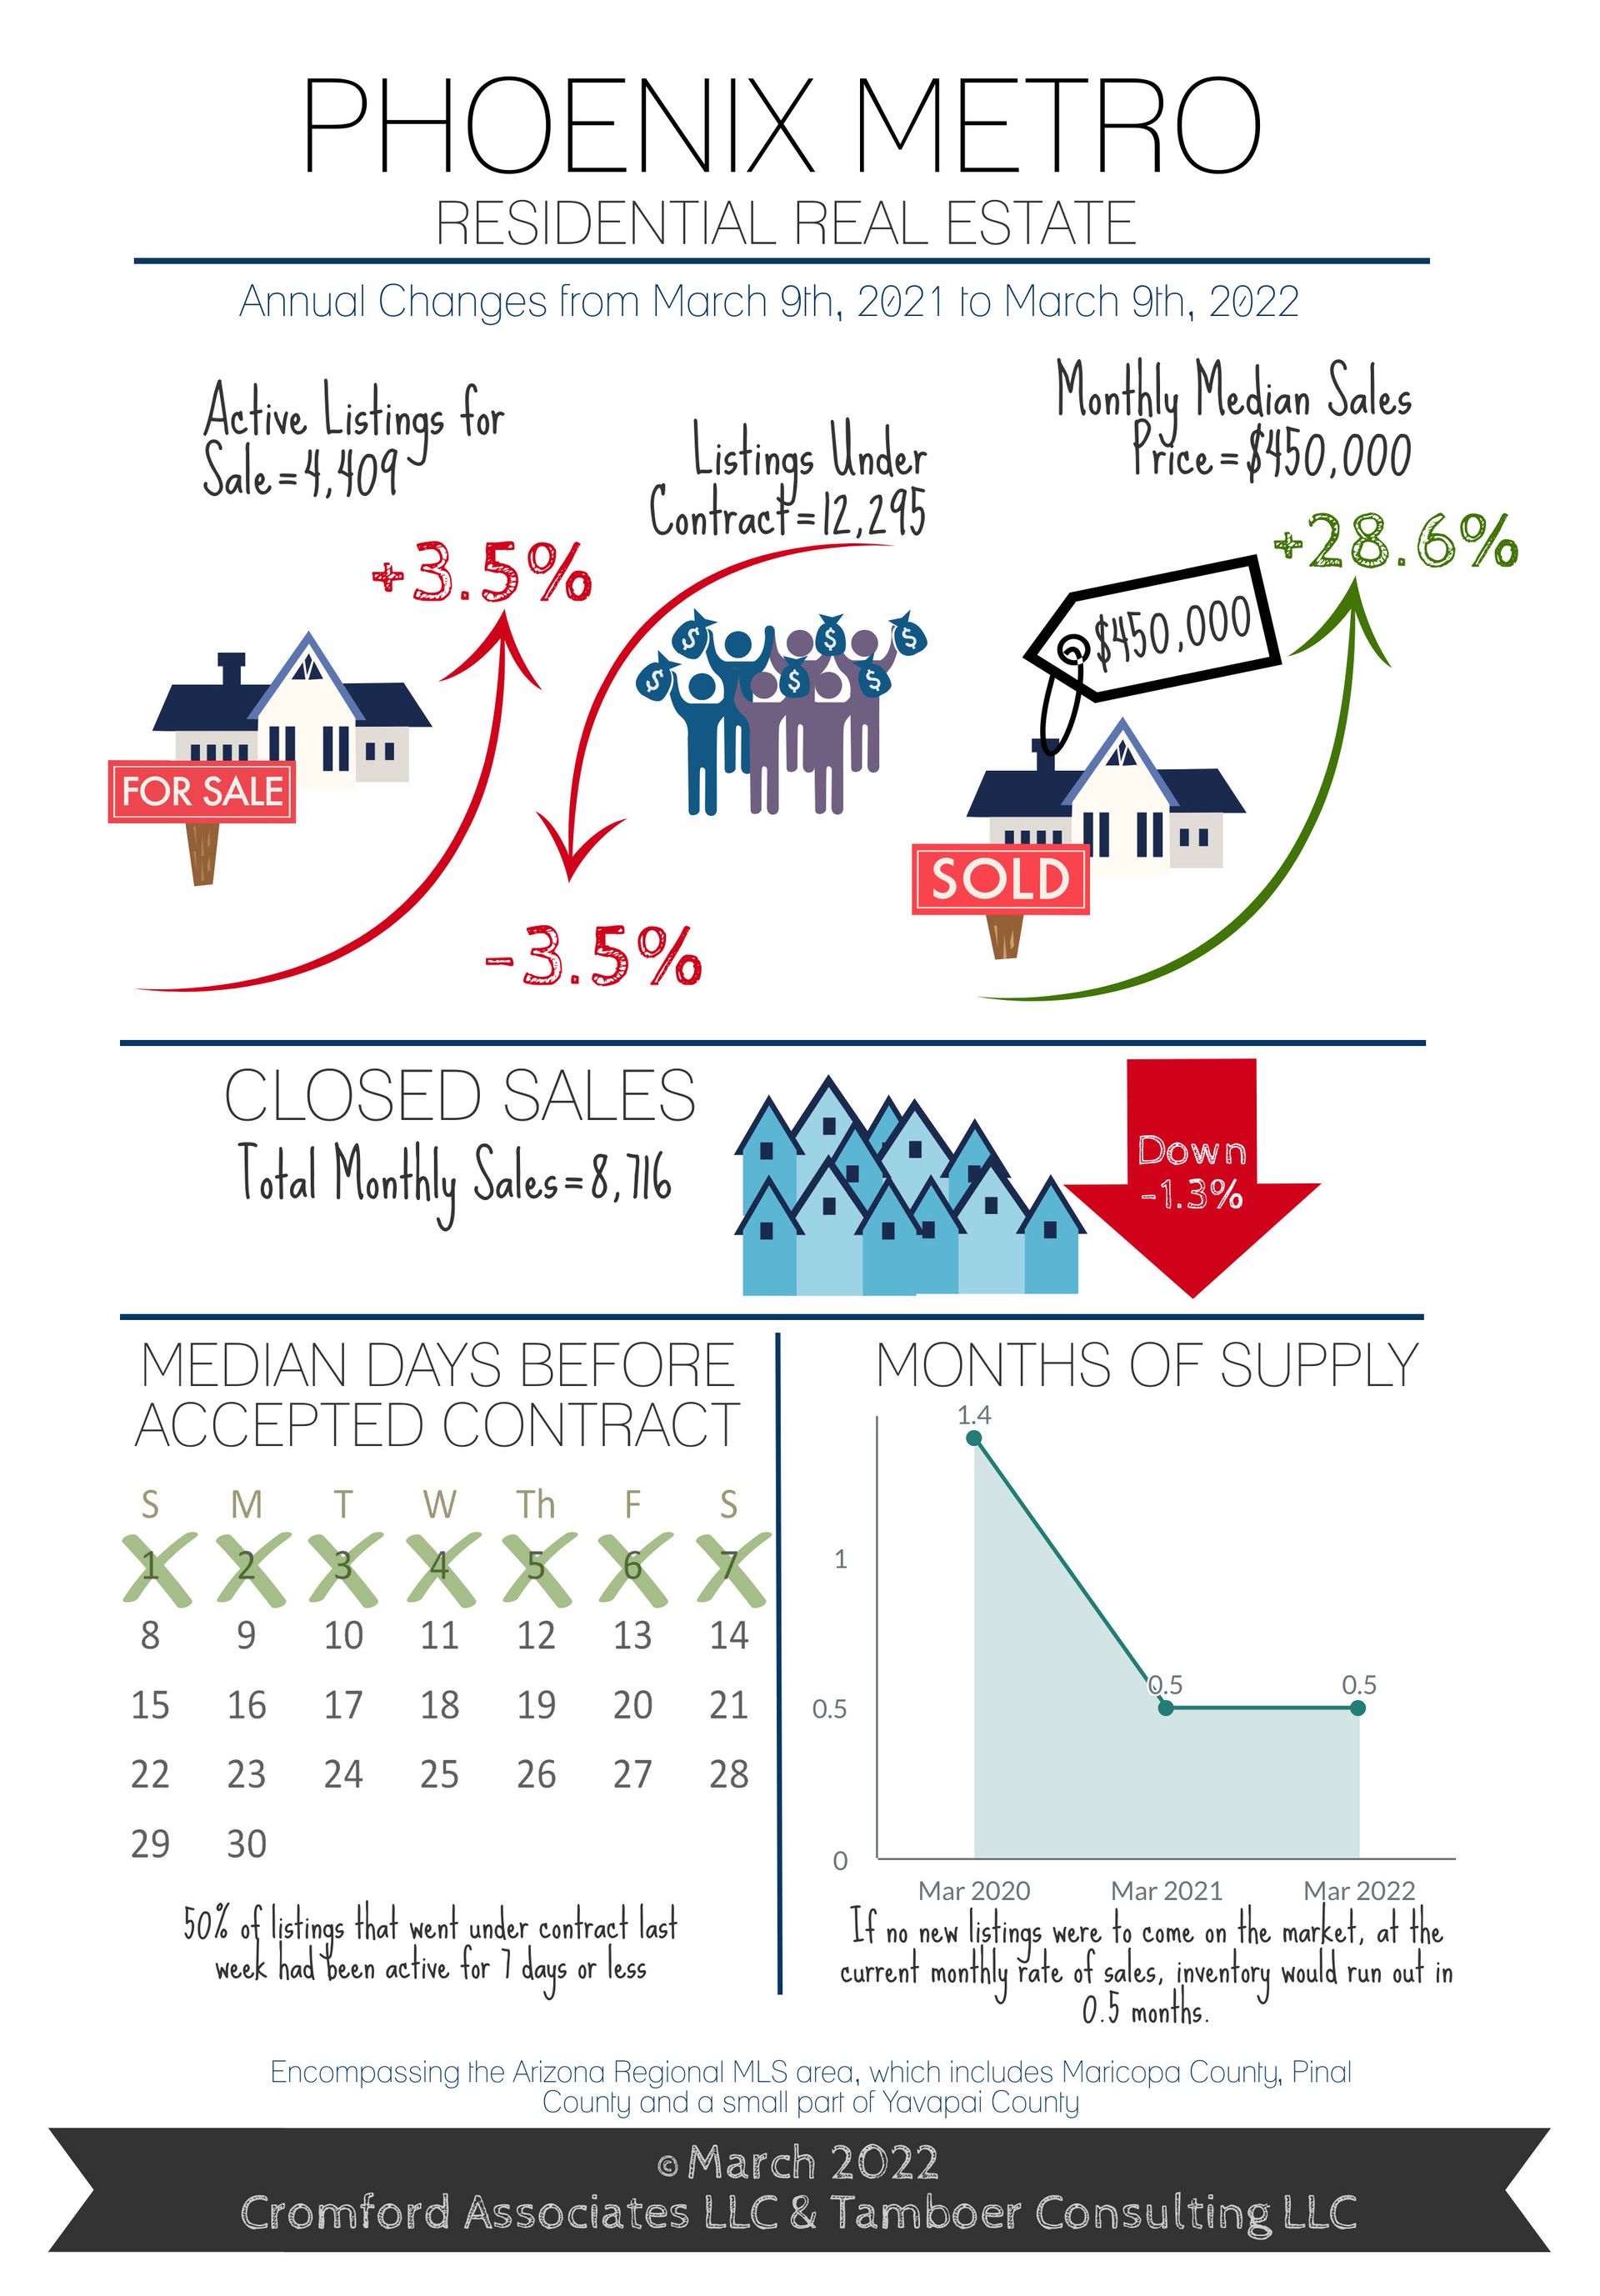
Don’t be fooled by the small increase in supply and decrease in demand compared to last year. The Greater Phoenix housing market is far from weak and will continue to see prices appreciate in the foreseeable future. Housing market indicators move slowly, unlike other types of investments such as stocks or currencies. When events such as interest rate hikes or stock market fluctuations occur, there isn’t an immediate measurable response in housing prices.
Consumers may “panic sell” stocks, crypto, or even their belongings; however, selling the roof over their head or a performing rental is typically the last resort. For this reason, jolts to the economy (like a sudden pandemic or economic sanctions) need to be in effect for many months without improvement for housing to see prices finally respond.
A unique player in the housing market is the short-term vacation rental. This product is specifically prolific in Northeast Valley cities such as Scottsdale, Paradise Valley and Cave Creek. According to AirDNA, Scottsdale alone was estimated to have 5,400 active short-term rentals as of December 2021, up 23% from the 4,400 estimated just last September and equating to over 4% of existing housing supply for that city. This changes the game in evaluating the value of property in high tourist areas like Kierland and Old Town Scottsdale. Instead of the traditional route utilizing past sales and adjusting for amenities for residential occupancy, certain homes are valued as individual businesses that come complete with a revenue stream, furnishings, established clients, websites, advertising contracts and hired support services. Under these circumstances, appraisers have their hands full distinguishing between a business sale and residential resale when evaluating appreciation.
To compound the issue in the Northeast Valley, new construction permits are not as abundant as they are in the West Valley and Southeast Valley; meaning there is little relief in the form of future new housing supply to accommodate both full and part time demand in the area.
For Sellers:
Greater Phoenix is not close to peaking in price for residential resale, not with supply of homes for sale 76% below normal for March and demand 13% above normal. However, be aware that the estimated payment for a 1,500-2,000 square foot home is now $77 higher than the median rent for a similar rental leased through the Arizona Regional MLS. The rental market responds to a shift in demand faster than the resale market does because landlords are faster to respond with a lease price reduction if their investment is vacant for too long.
In 2021, median asking rents jumped from $1,855 in January to a peak of $2,395 by September, an increase of $540, and have remained between $2,300-$2,400 per month since. Tenants accommodated the increases until about June, then the median for closed leases stalled at $2,100 per month. Despite the stall, landlords continued to increase their asking rent and saw the supply of available rentals rise by 60%. This is a significant development because the only reason a landlord would decide to compensate a real estate agent by listing their rental in the MLS is if they’re not renting it fast enough through other means.
You may be wondering why this matters to you as a home seller. The health of the rental market is often looked at as an indicator for the health of the resale market. If lease rates continue to go up and are successfully closed at those rates, then that’s a good indicator for resale prices as well. When rental rates reach a ceiling and stay there for months, then it’s possible the resale market may follow, but as stated earlier, resale is slow to respond. It could take many more months before the shift is realized, so for today it’s business as usual.
Commentary written by Tina Tamboer, Senior Housing Analyst with The Cromford Report
©2022 Cromford Associates LLC and Tamboer Consulting LLC









