
January 2025 Phoenix Real Estate Snapshot
Home Prices Rose 4.7% ... Or Did They?
What was Hot in December, and What Was Not...
For Buyers:
Buyer’s season has begun and new listings for January are the strongest Greater Phoenix has seen since 2020. New listings waned in November and December, so this rebound is a refreshing start for buyers in 2025 as supply is rising and sellers continue to be open to incentives and negotiations.
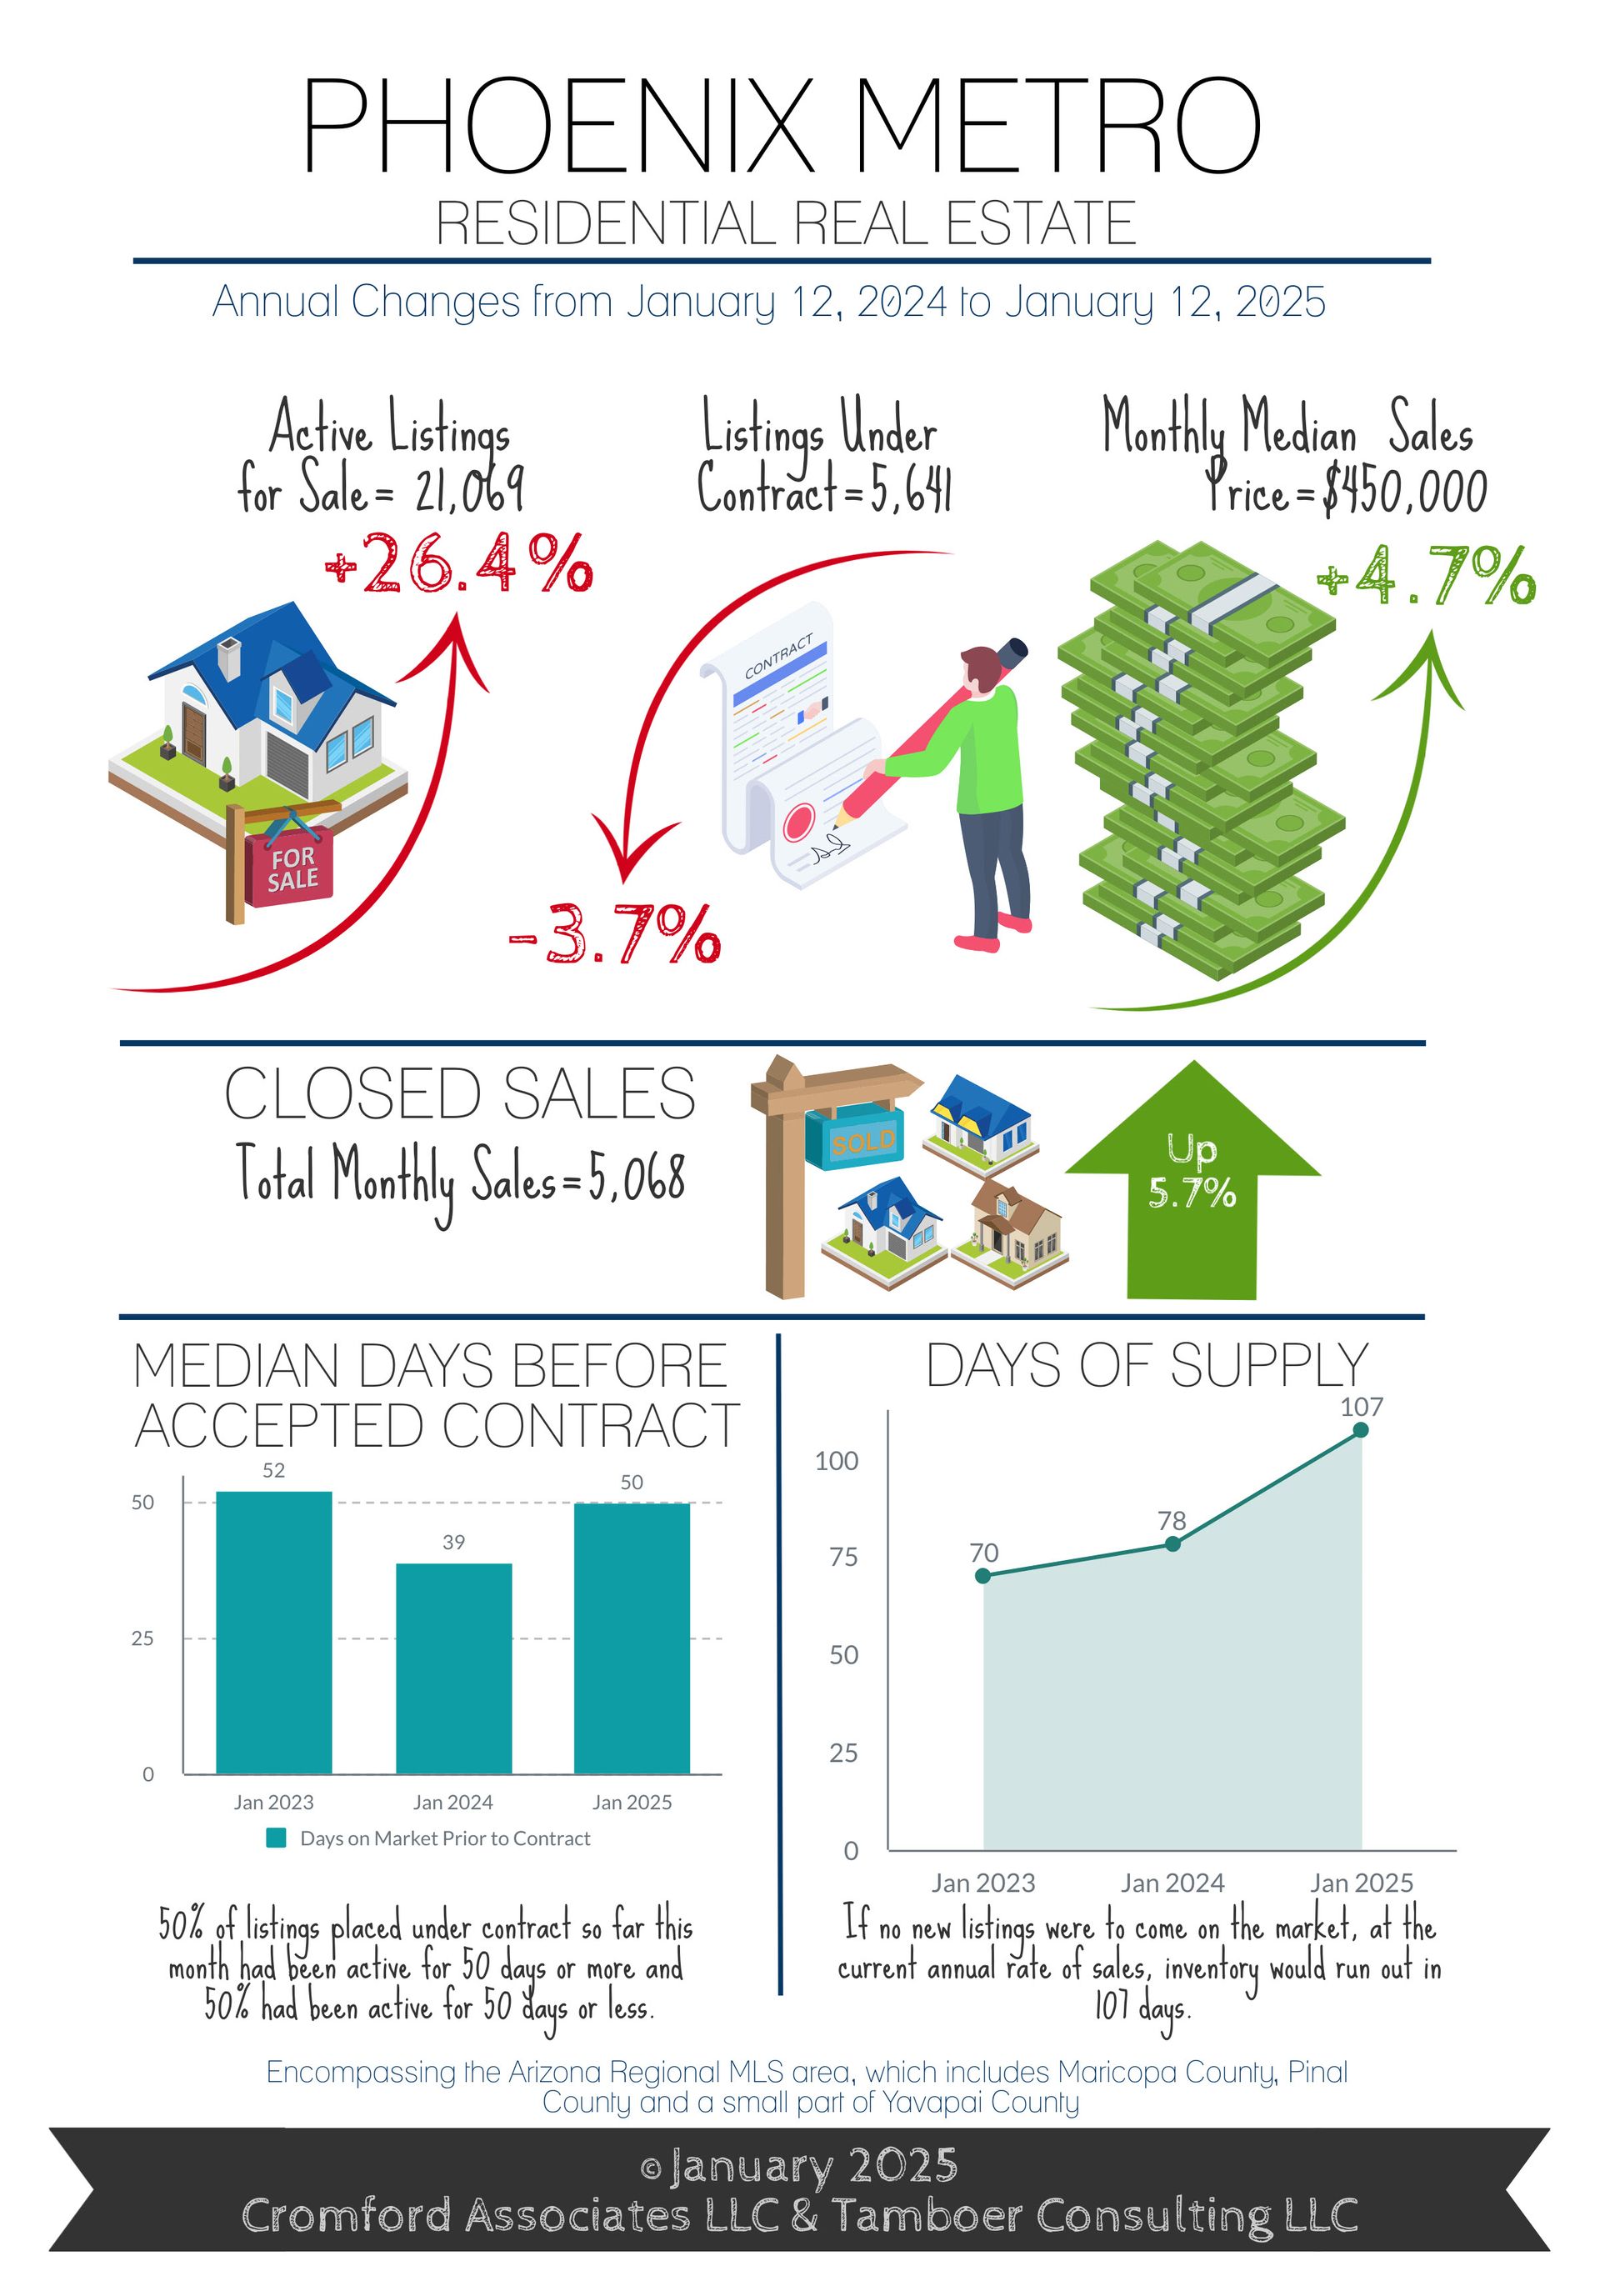
Hovering around 7.25%, mortgage rates continue to limit the general buyer pool. Currently, just over 5,600 listings are under contract in the MLS, but normally we expect to see at least 7,000-8,000 at this time of year. On the other hand, supply is around 21,000, the highest entry point for January since 2016-2017, fostering an environment favorable towards qualified buyers.
These conditions suggest home price projections should remain flat, either at or slightly lower than the rate of inflation annually. However, December price measures were significantly higher than the rate of inflation with a +4.7% growth in the median sales price and +6.7% for price per square foot. How can this be? Well, blame it on the luxury market.
Mortgage rates suppress buyers on the low end of the price scale, but don’t affect those on the high end. As crypto and stock investments spiked after the 2024 election, luxury sales over $1M over surged +37% over last December compared to just +11% for homes under $1M. This caused December’s data set to be more top heavy in luxury and skewed price appreciation measures high.
When December sales over $1M are eliminated, the annual appreciation rate per square foot falls from 6.7% to just 2.5%, in line with the rate of inflation. This is expected in a market that bounced between a buyer’s market and balance for most of the year. While mortgage rates are not ideal, they are temporary. Prices are stable, incentives abound, and sellers are negotiable. There’s no harm in getting qualified and taking a look.
For Sellers:
January is starting off pretty frigid overall, but not for everyone. When taking a broad look at Greater Phoenix, the gap between supply and demand can seem insurmountable. However, specific target price ranges and areas are lighting up the map with heated activity.
For example, the West Valley lights up in the first-time home-buyer price ranges between $250K-$400K, specifically Surprise, Waddell, Avondale, Tolleson, and Southwest Phoenix as high builder incentives combat affordability issues. Also lighting up with frenzy activity in this range is Mesa (85204), North Gilbert, and Chandler (85226).
The Southeast Valley heats up in the $400K-$500K range, as does Tolleson and North Glendale.
Luxury condo sales over $1.5M are insanely popular in Scottsdale 85251, 85255 and Paradise Valley. However, the condo market in general is under the most stress with many areas seeing zero contract activity and a 67% increase in competing supply under $400K. Condos between $300K-$500K and $600K-$800K rose in value from January-April last year, but those gains disappeared from April-December*. They are now starting 2025 dead even with January 2024 at 0% appreciation.
Homeowners insurance is going to be a major topic this year, especially for the condo market as many HOAs can no longer shoulder the extra costs without raising dues. More landlords facing increased insurance costs, HOA fees, and lower rents on apartment-style condos are experiencing lower returns and looking for an exit strategy.
As the housing market enters its high season, things will look up for sellers from now through May. How much contract activity lights up depends mostly on mortgage rates, however. Until then, sellers must continue to offer high incentives to buy down rates, keep their properties in top condition to compete, and resist the urge to press the market on price.
*using a 3-month moving average, sales price per square foot
Commentary written by Tina Tamboer, Senior Housing Analyst with The Cromford Report
©2025 Cromford Associates LLC and Tamboer Consulting LLC









