
December 2024 Phoenix Real Estate Snapshot
Predictions for 2025, What to Expect in Q1
It’s a Buyer’s Market, Will Prices Drop?
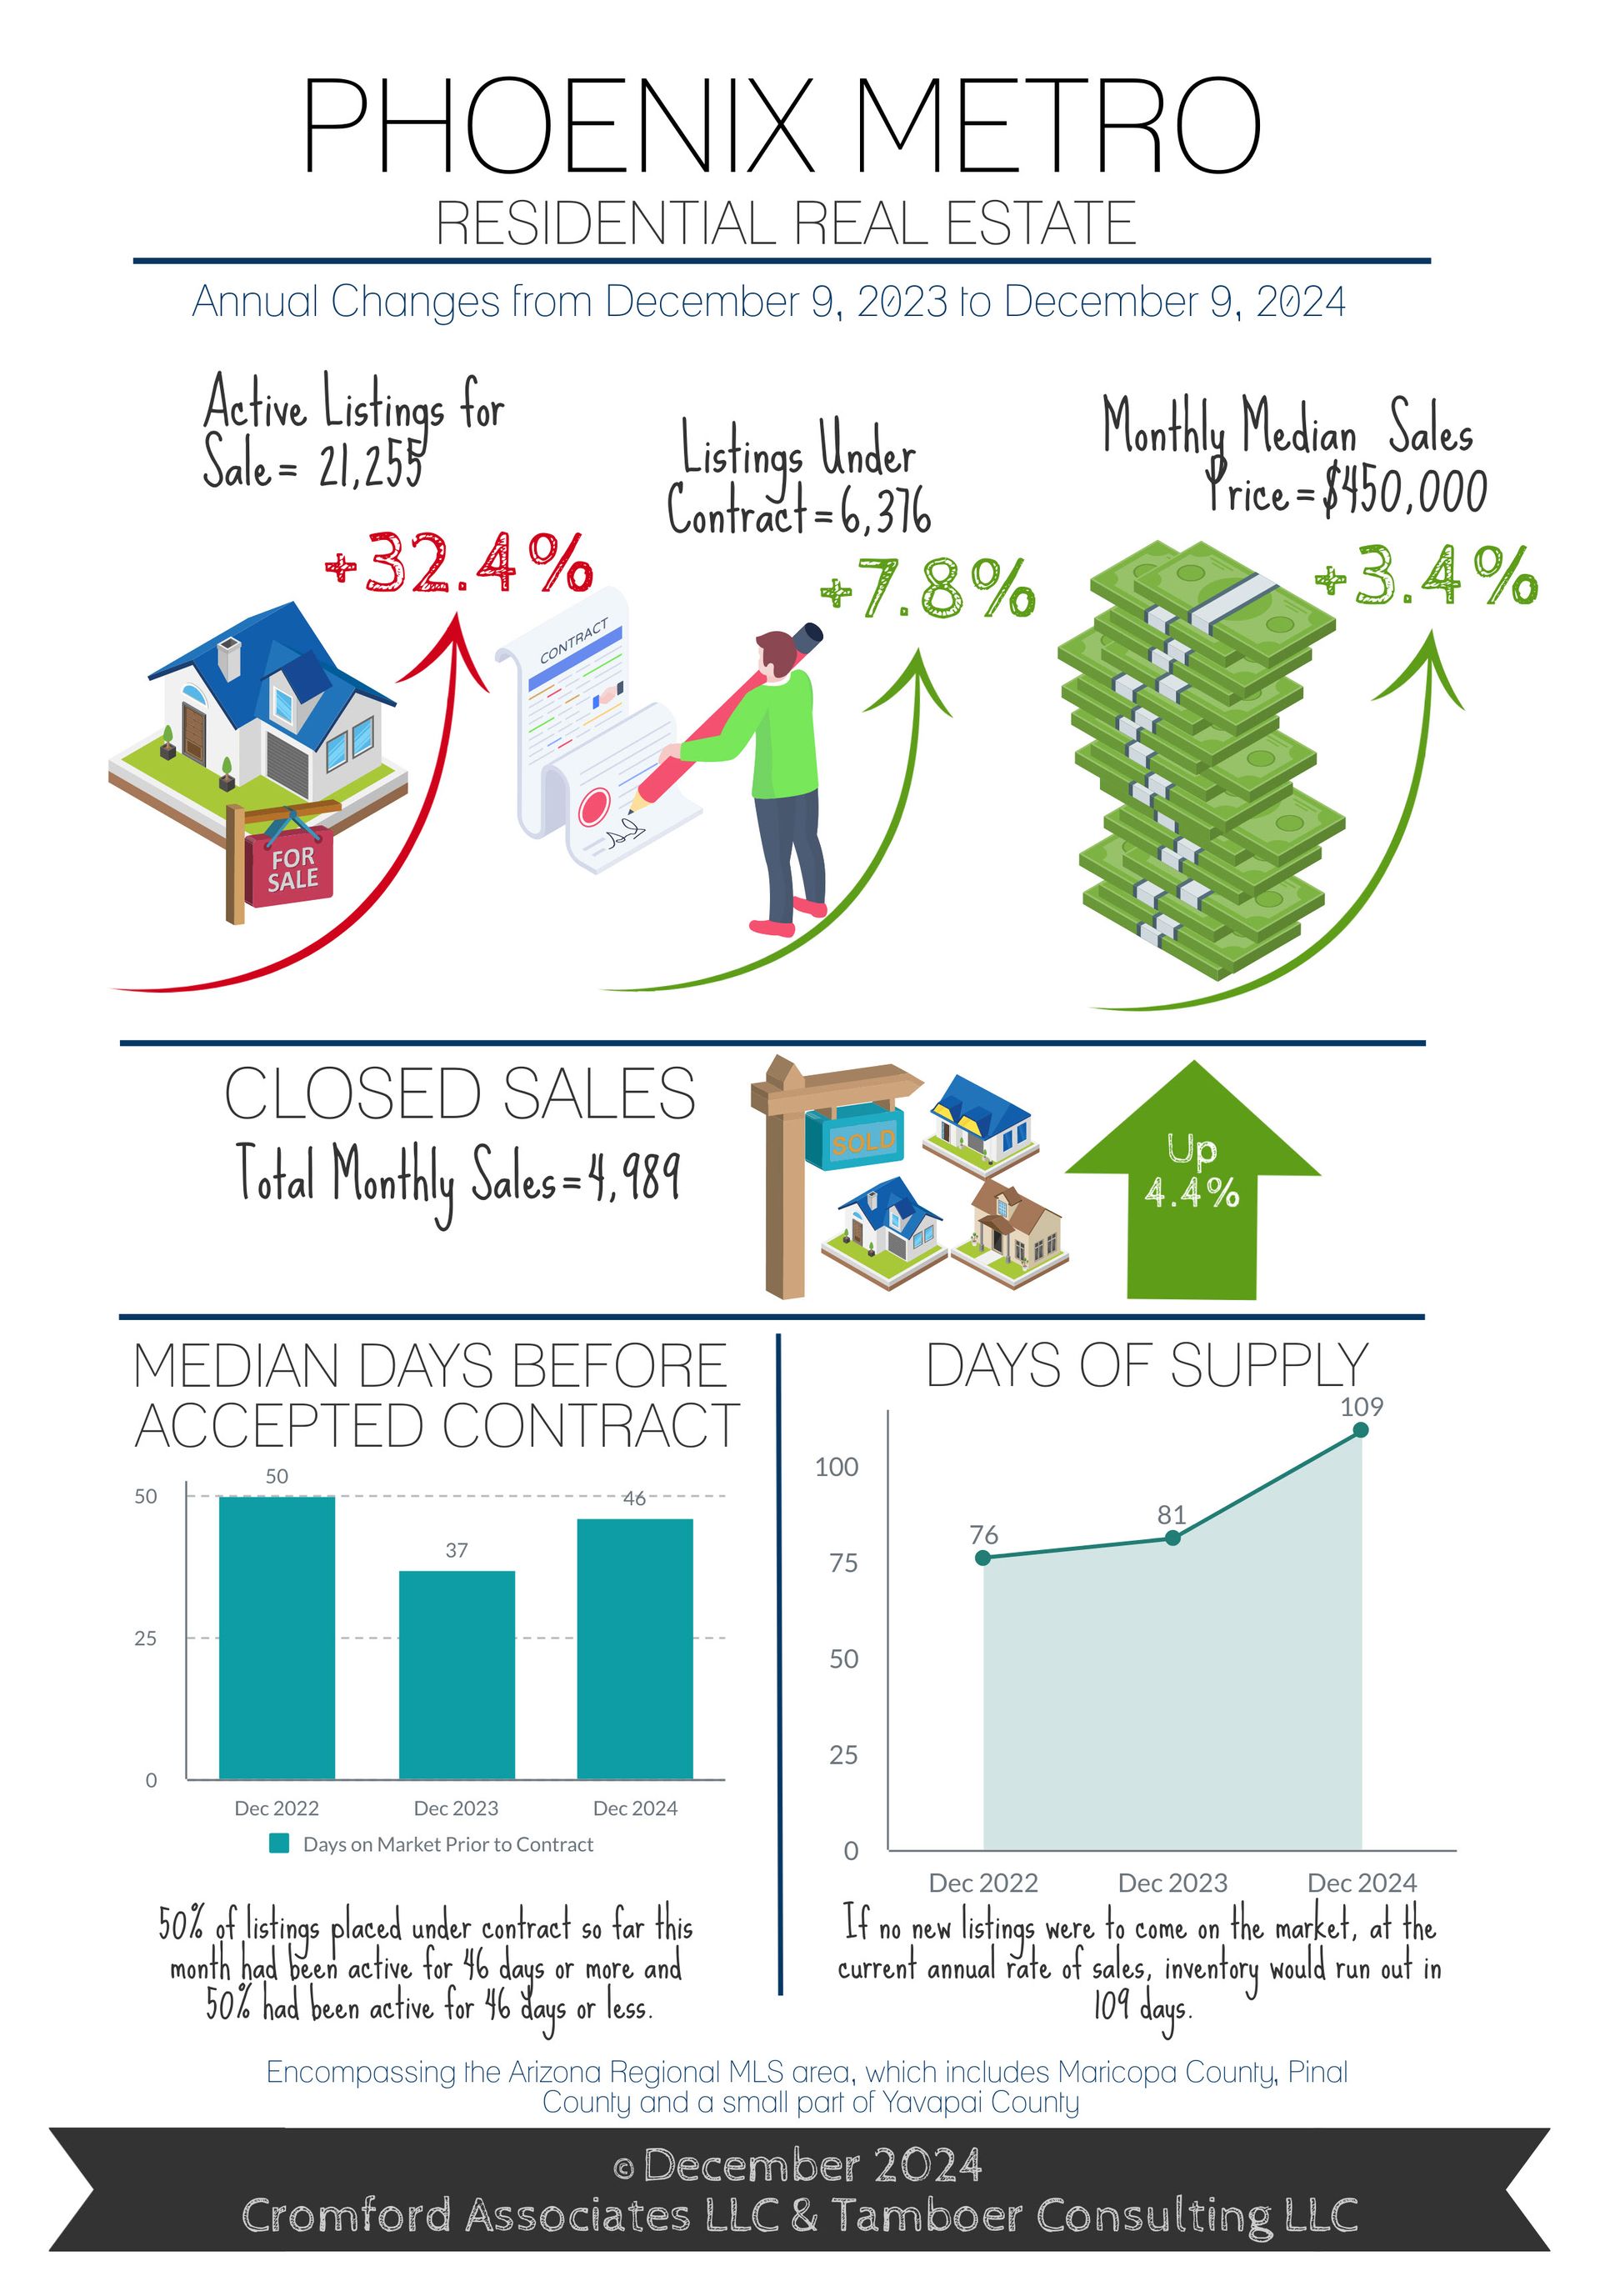
For Buyers:
The buyer’s market in Greater Phoenix is still young at just over 5 weeks old but isn’t getting worse thanks to supply stabilizing over the past two weeks. For some, this scenario brings anticipation of a decline in sales prices, however there’s more to this buyer’s market than meets the eye. There have only been 3 other buyer’s markets in Greater Phoenix over the last 25 years, and they are all unique in their circumstances and thus give us little to compare with our current market.
What can we expect in terms of price trends today with our new baby buyer’s market? That depends on how long the market stays friendly towards buyers. Sales price is the last measure to respond to a shift from a seller advantage to a buyers advantage. The first measure to crack is the seller’s asking price. When that doesn’t improve buyer interest, then buyer incentives increase. If that doesn’t improve sales, then negotiations begin to shave more off of the seller’s asking price. The whole process for sales prices to respond can take 3-6 months; so if the buyer’s market is brief there may be little effect on sales price trends.
Currently, price measures are flat and buyer incentives are high at 53% of November MLS closings with a median cost to sellers of $10,000. The last 6 months have the highest percentage of concessions ever recorded in Greater Phoenix and double the long term normal concession range of $4,000-$5,000.
The moral of this story is don’t rely on price measures to reflect the best time to buy. By the time prices hit a bottom the party is already over. Additionally, measures don’t reflect the plethora of “shadow” benefits that happen outside of price during buyer’s markets, like rate buy-downs, loan assumptions, seller acceptance of contingent sales, and major property improvements performed prior to close.
Will prices drop? Currently, December sales price measures are trending up over November, not down. If we attempt to correlate to the last buyer’s market of 2022 that lasted 4 weeks between November and December, price measures dropped just 2.7% during that time before immediately bouncing up again in January and February when mortgage rates declined to 6%. Buyers who bought at that time have the most appreciation accumulated within the last 3 years.
For Sellers:
It continues to be a frigid market for most zip codes in Greater Phoenix with the lowest contract ratio* we’ve seen since January 2015, 10 years ago. Mortgage rates have improved slightly from 7.1% in November to 6.8% as of December 12th, and most national lending experts believe they’ll stagnate for the rest of December. In order to see a notable improvement in demand, these same experts agree that mortgage rates need to drop below 6.5%. Sellers struggling the most are those who have owned for less than 3 years, and especially those who purchased in mid-2022 at the height of market price. Those sellers may need to hold on for another year or so to see enough appreciation to recoup their selling costs and down payment. However, those who have owned for 3.5 years or more still have significant equity to manage the expenses of selling in today’s market.
Sellers who purchased in 2021 have a possible advantage over those who purchased after then, and that’s a much lower mortgage rate which may be assumable by a buyer. Both VA and FHA mortgages are automatically assumable for a qualified buyer and this option could save the seller thousands of dollars in costly buyer incentives in addition to saving the buyer hundreds per month in their payment.
After 2.5 years of a challenging housing market, there is one thing sellers can look forward to right now; the Spring buying season that kicks off in mid-January and continues through May every year. The Spring of 2024 saw contracts increase 83% from January through May, and the bounce was 85% in Spring 2023. Pre-Covid 2019, the Spring bounce was 105%. If mortgage rates decline as expected in 2025, this Spring could see similar improvements for sellers.
*listings under contract divided by active listings
Commentary written by Tina Tamboer, Senior Housing Analyst with The Cromford Report
©2024 Cromford Associates LLC and Tamboer Consulting LLC









