
November 2023 Phoenix Real Estate Snapshot
It’s a Buyer’s Market Once Again In These 8 Cities,
Median Seller Incentive Hits a New High
For Buyers:
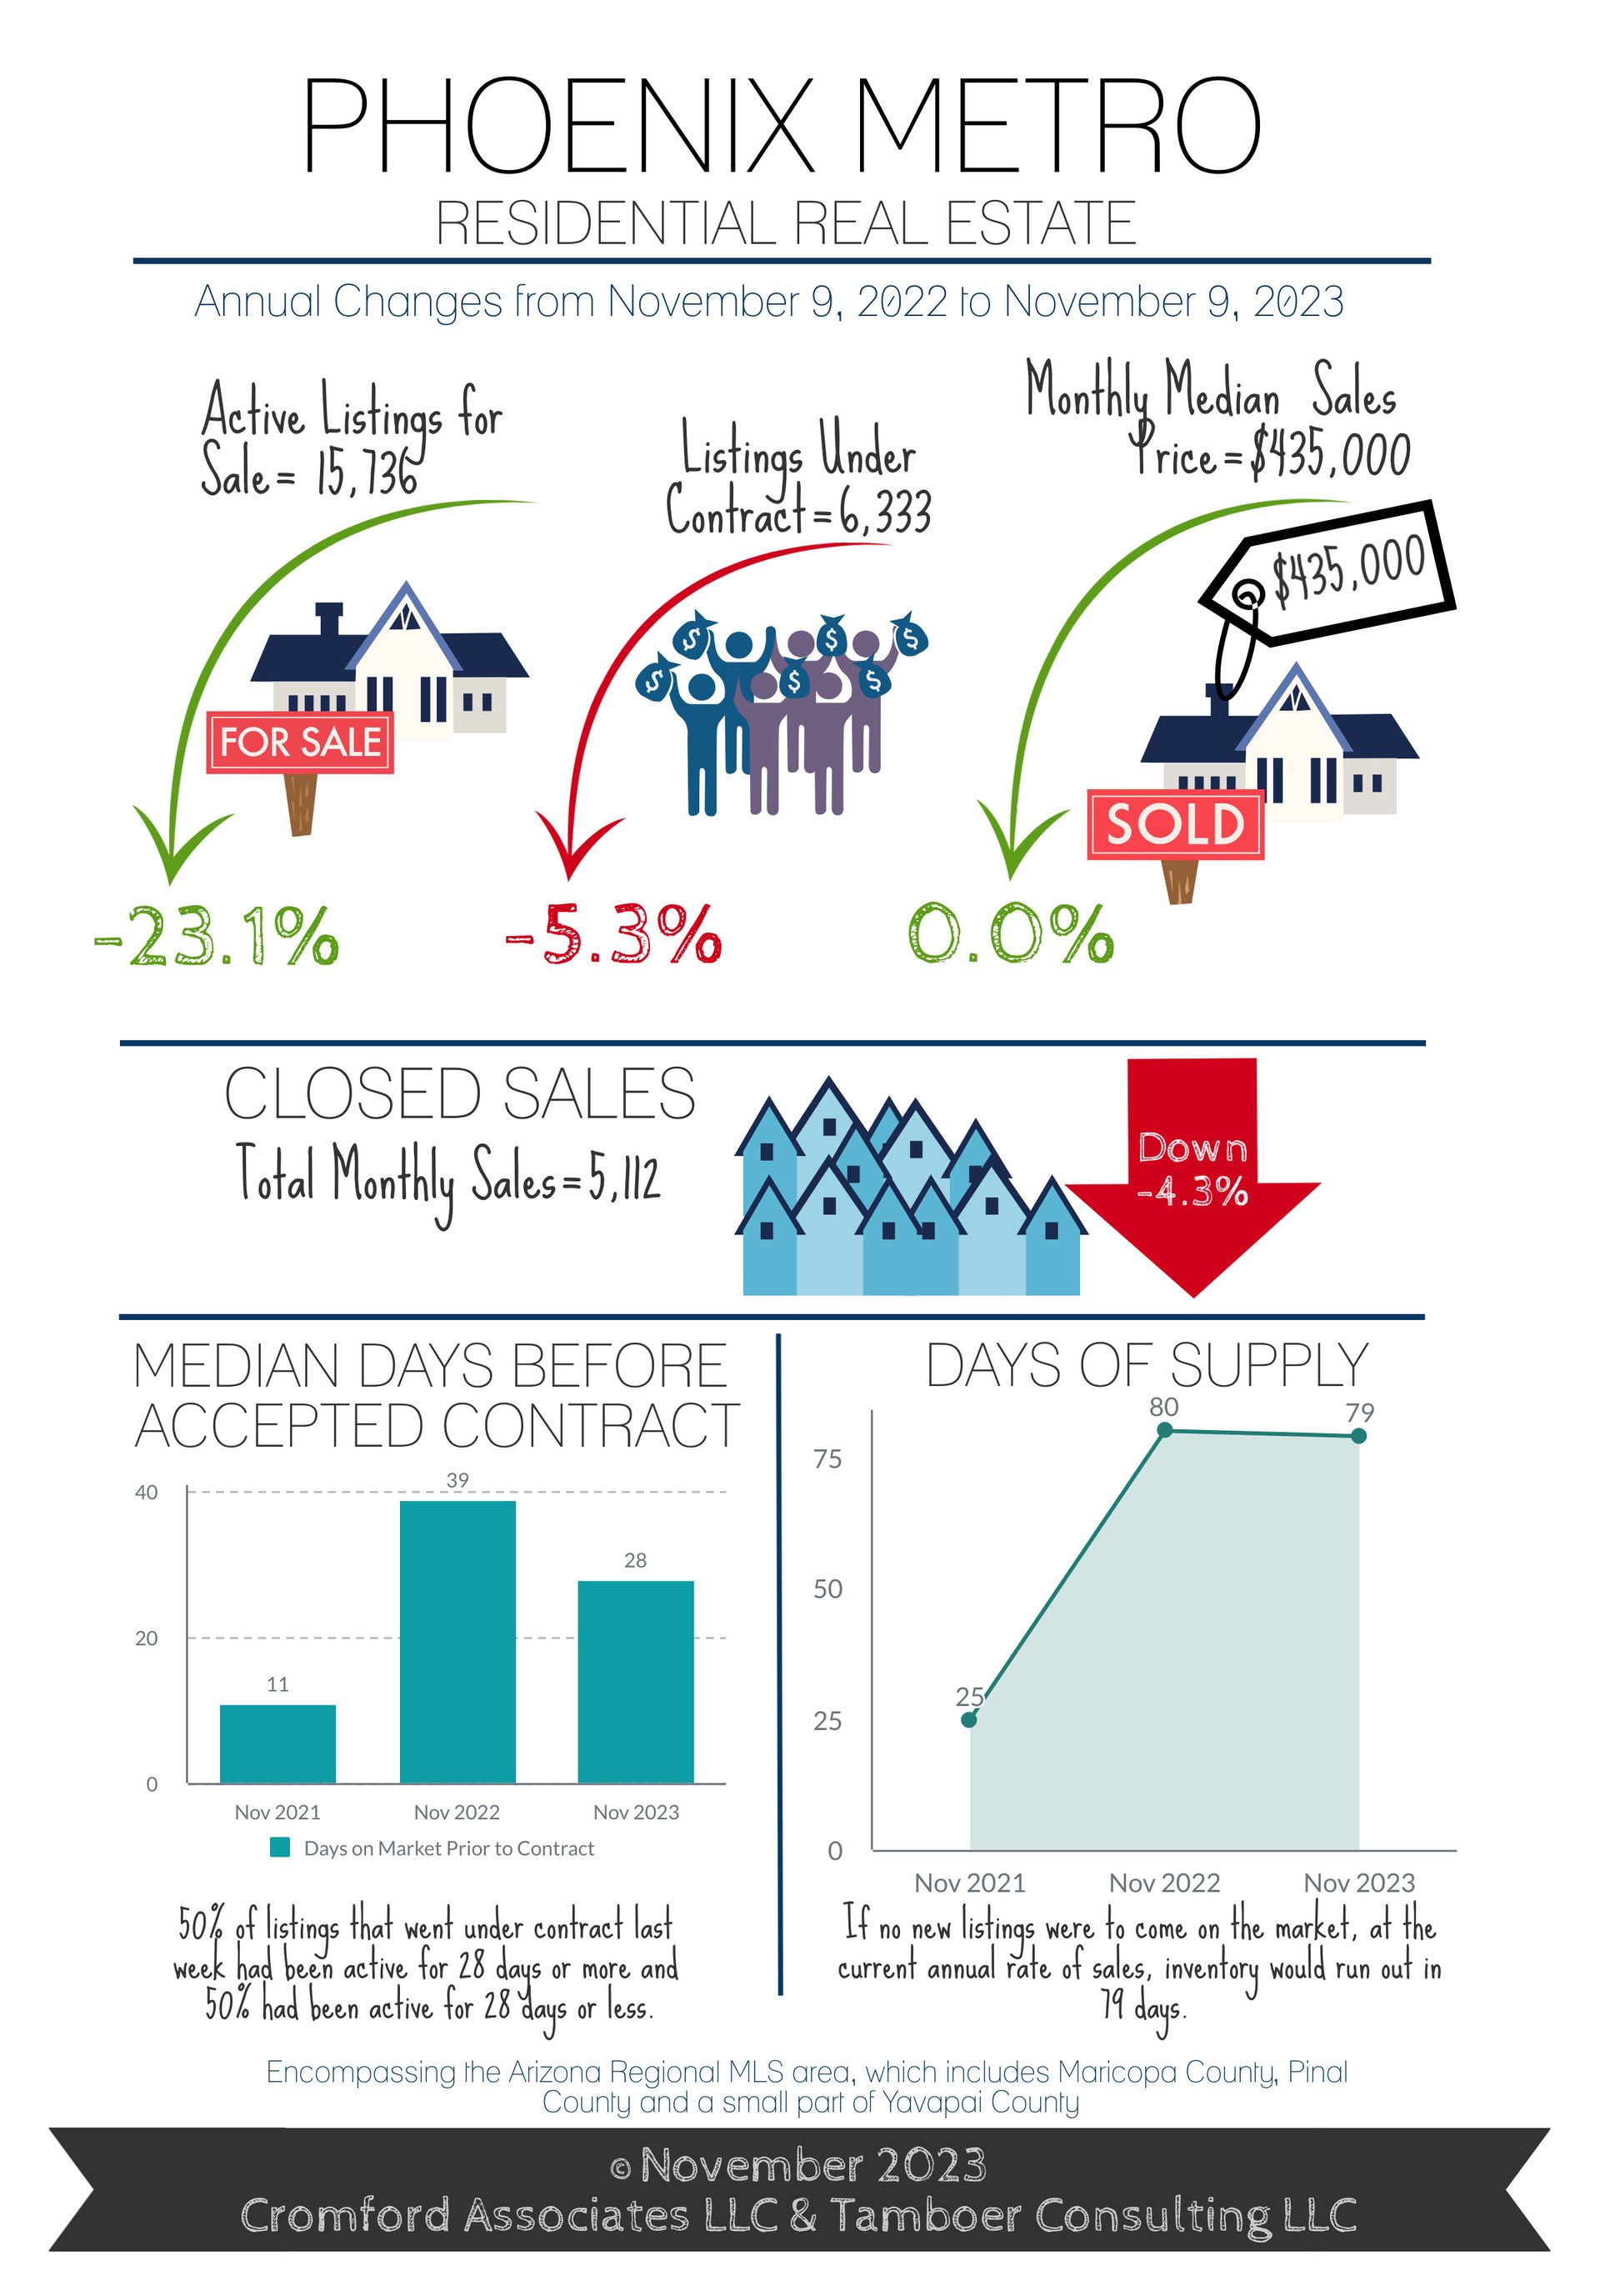
Buyers who felt they lost out on the buyer’s market last year will be getting another chance this year. The Greater Phoenix housing market, on the whole, only has a few days left before it enters a balanced market. However, as 18 cities are still in seller’s markets, there are 11 that are either already in balance or in buyer’s markets.
What does a buyer’s market mean for buyers? Most buyers assume it means that sales prices will come down, but by the time sales price measures show a decline, the buyer’s market could be 2 months old or already over like it was last year. The first thing to move isn’t the sales price, but the list price combined with higher seller incentives for buyers.
Over the past 2 months, as mortgage rates peaked at 8%, weekly price reductions increased in number by 33%. Meanwhile, the median seller incentive to buyers increased from $8,000 to a new high of $9,900 so far this November, while the previous high was recorded last January at $9,700. Increases in the dollar amount and percentage of sales with incentives were most noticeable in the first-time home-buyer price range of $300K-$400K and also in cities with a significant number of competing new home communities.
How long this trend will last is unclear as conventional mortgage rates fell sharply this month to 7.3% and FHA/VA fell to 6.7%. The higher mortgage rates climb, the higher the cost to the seller to buy them down. Mortgage rates have been nearly impossible for experts to predict over the past 18 months, however there are strong feelings that the end is near for rate hikes by the Federal Reserve. If mortgage rates decline in response, then the current market decline will be short lived.
In short, it’s a good idea for buyers to stay engaged and vigilant in identifying opportunities in November and December. Once 2024 begins, the peak home-buying season is back in swing with more buyer competition.
For Sellers:
This is not a good time to test a price higher than market value for your home. As the seller’s market weakens on a daily basis, it’s the outskirts of town that are affected first as the interior cities follow quickly. As of November 9th, the following cities are in buyer’s markets: Surprise, Litchfield Park, Goodyear, Buckeye, Maricopa, Casa Grande, Gold Canyon, and Queen Creek. Balanced markets are Cave Creek, Peoria, and Sun City. All others are still seller’s markets, but weakening fast.
Seasonally, the best time to list your home is not in the 4th quarter. However, sellers always want to be selling in a seller’s market. While it’s not a bad idea to wait until the 1st quarter typically, under these circumstances the benefit could be offset by a weaker buyer’s market. That means more competition from new listings, more days on market, and more price reductions. The determining factor that could change the course of the current market trend is mortgage rates, which have been unpredictable and volatile this year.
For those who need to sell, you may get your asking price, but at a higher expense as long as rates are elevated. As a result, sales price measures will not show a decline, but the sellers’ net proceeds will be squeezed. It may not be the market we love, but it’s the market we’re with.
Commentary written by Tina Tamboer, Senior Housing Analyst with The Cromford Report
©2023 Cromford Associates LLC and Tamboer Consulting LLC









