
May 2023 Phoenix Real Estate Snapshot
Greater Phoenix Losing 246 Listings per Week in 2023,
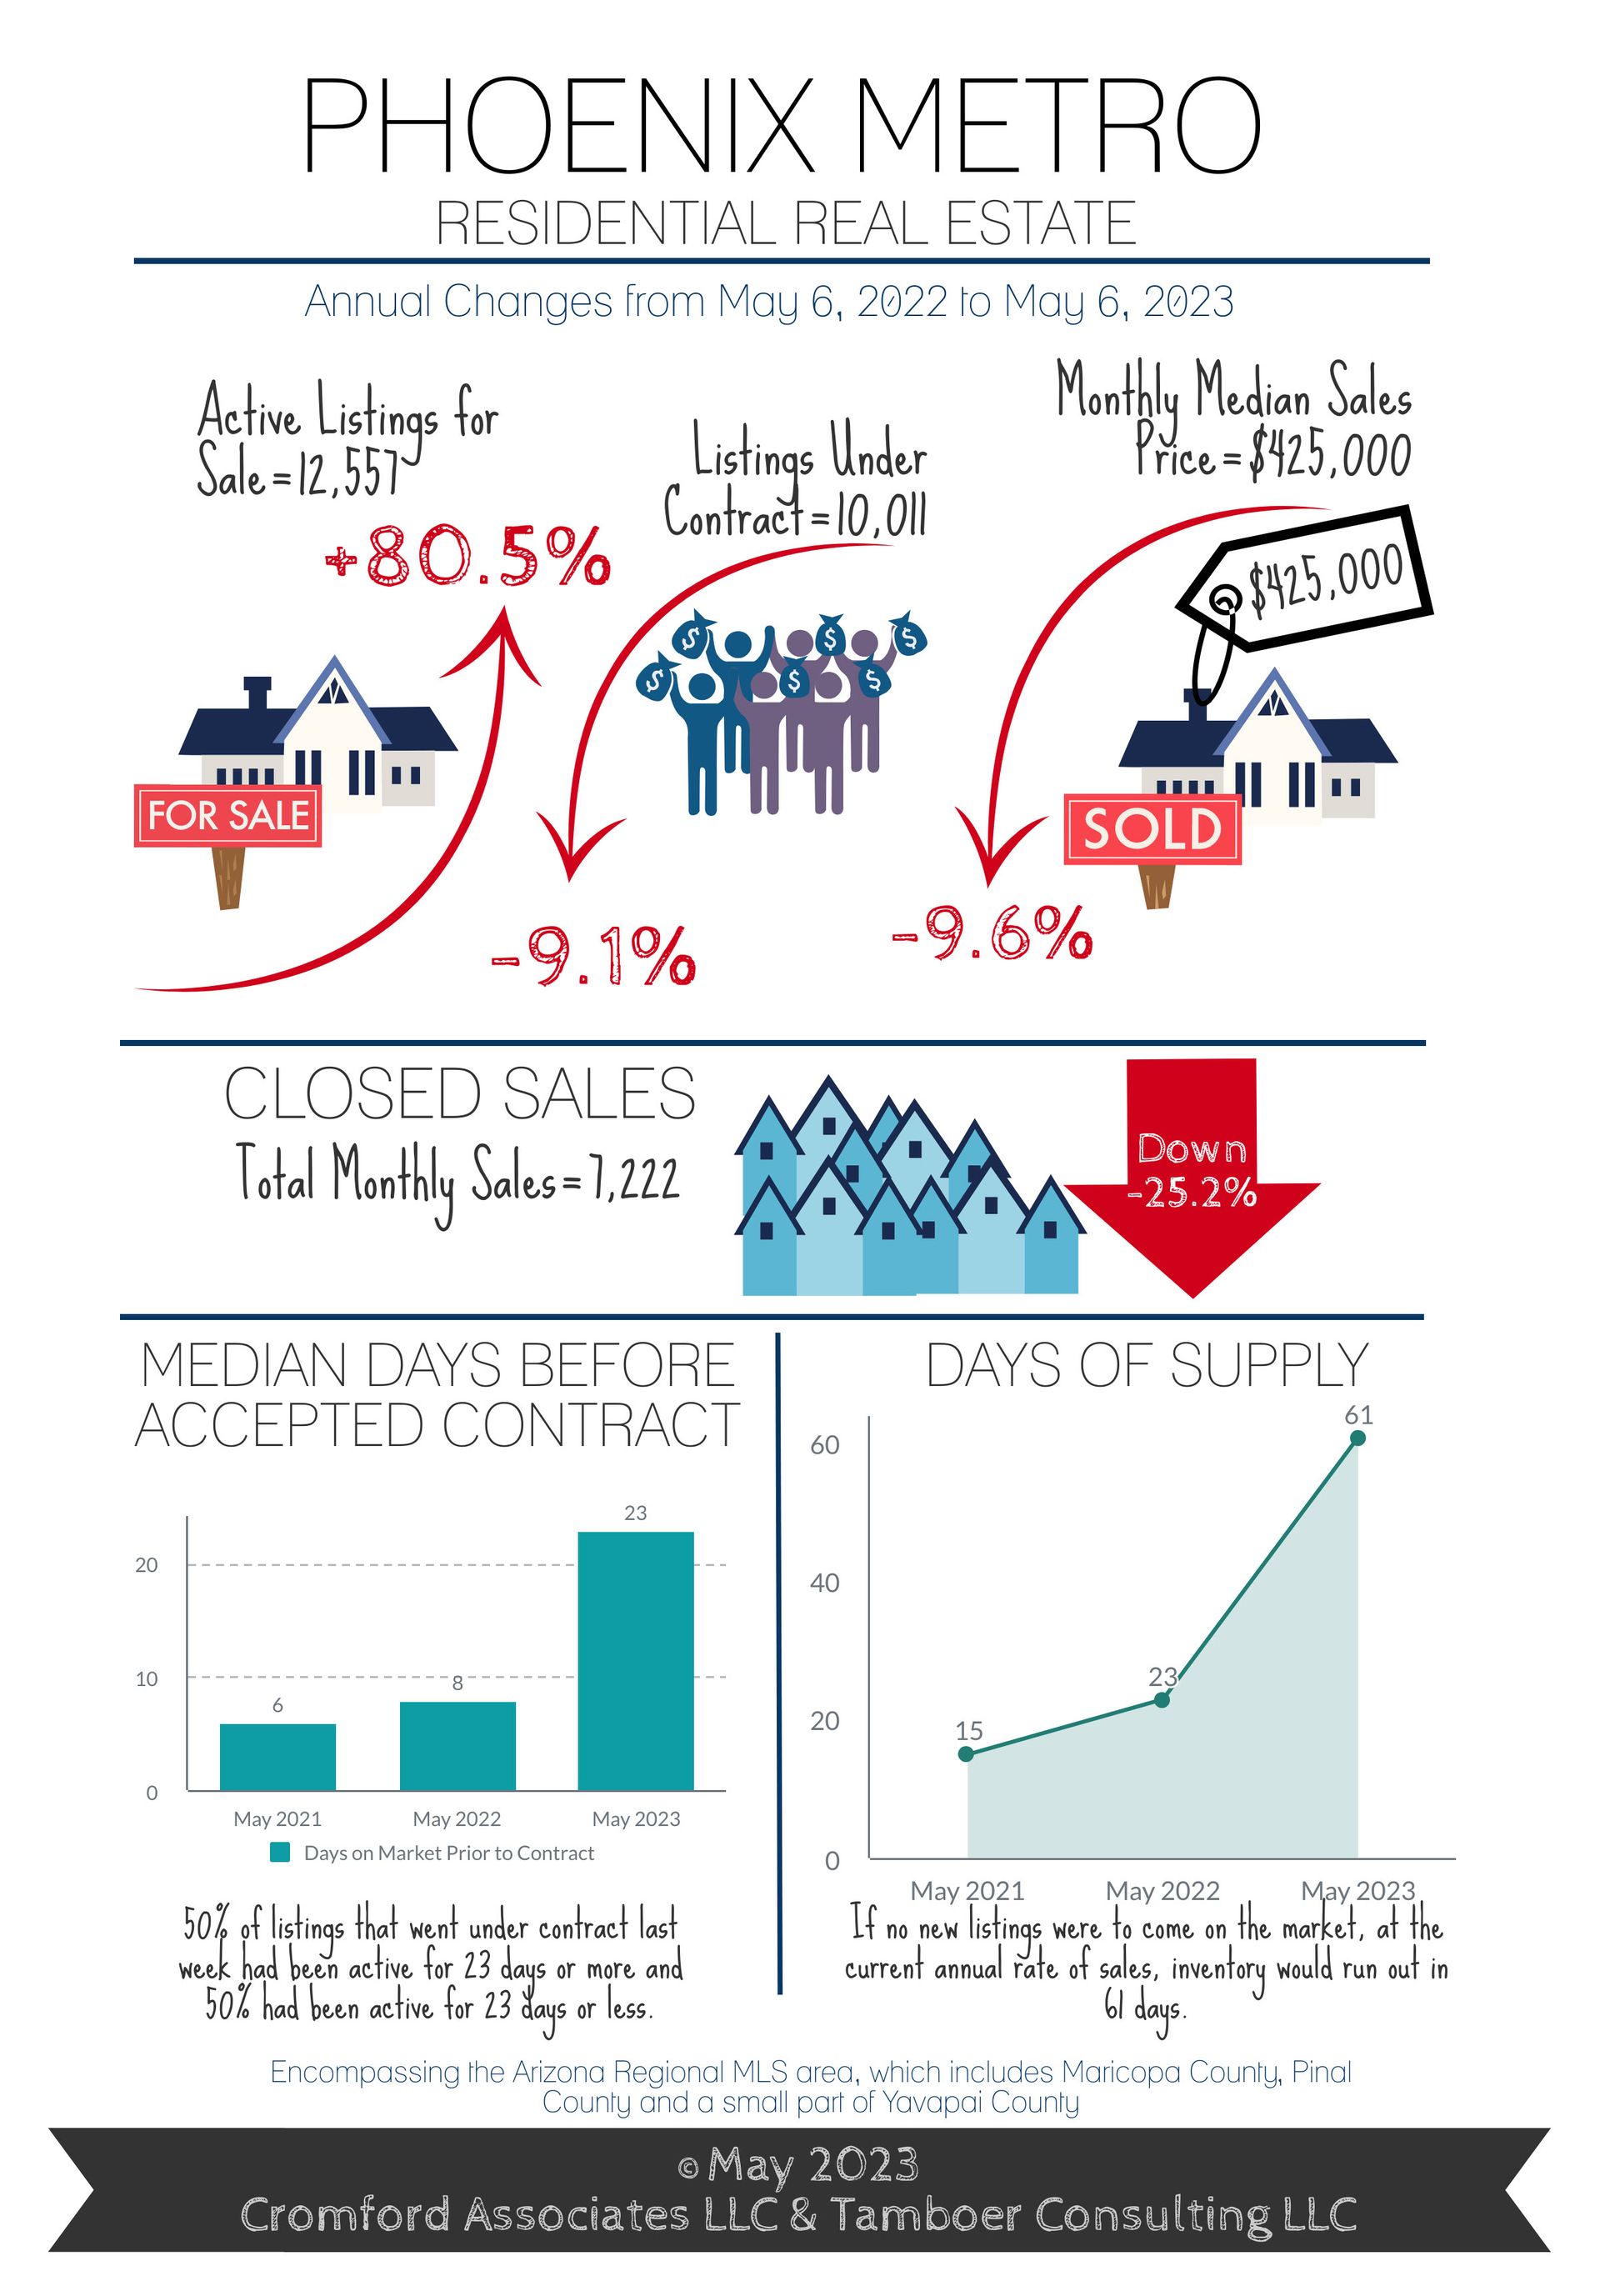
Prices Recovering, Median Up to $425K in May
For Buyers:
The sharp decline in supply for Greater Phoenix is a good reason for buyers to have a sense of urgency about purchasing a home. Since the beginning of 2023, supply counts have been declining at an average rate of 246 listings per week and since the peak in October, total supply is down 42%. At this rate, the effects of the massive supply surge last year will be erased and the year-over-year change will be negative within 6 weeks. In fact, the Valley could see extremely low supply similar to 2021 and 2022 within 7-8 months if a significant source of supply doesn’t emerge.
While permits for new single-family homes dropped by 74% over the last half of last year, they have doubled since December. While that sounds encouraging, the build time for a new home is estimated at about one year. So, as the builders move through their permits and inventory from the first part of last year, there are fewer permits from the latter half to significantly boost new supply for sale going forward this year.
That being said, while prices are rising and recovering from the 2022 decline, they’re not spiking right now. This is good news. The appreciation rate since December is considerably more modest than what the market saw from 2020-2022. For perspective, the first part of 2022 saw the median price in Greater Phoenix rise from $425K in December to $470K by May, an average of 2% per month. This year, after declining to $418K in December, the median sales price has risen to just $425K as of this month, which is significantly more sustainable.
Mortgage rate predictions, meanwhile, are trending down. This month, organizations such as the Mortgage Banker’s Association, Freddie Mac, Compass Bank and the National Association of Realtors all declared expectations that rates may drop into the mid– to low– 5% range by the end of the year. The last time rates were that low was August 2022, but with the dominance of seller-paid buy-downs today that drop the going rate by 1-3%, and FHA rates that typically run well below conventional rates, a decline in conventional rate to the 5% range could spur a surge in both supply and demand.
For Sellers:
Unaffected by mortgage rates, the market over $1M has seen its 2nd best year in Greater Phoenix so far. May is typically the peak of the market for buyer activity in the top tier price ranges, and after local temperatures top 100 degrees, we tend to see a noticeable slowdown as they flee to cooler climates. Expect to see a spike in luxury homes cancelling or expiring their listings temporarily in June and then re-activate them in the fall.
If your home is under $600K, you will want to keep an open mind about FHA buyers. Effective January 2023, the loan limit for FHA was raised to $530K and effective March 2023, FHA announced they were reducing the mortgage insurance premiums on their loans from 0.85% of the loan amount to 0.55%. On a $400,000-$500,000 loan, the monthly savings is about $100 off a buyer’s payment. Combine that with a 30-year fixed rate that runs from a quarter to a half point below the conventional rate, and that can knock off another $100 from the payment. With a possible $200 savings every month, more well-qualified buyers are choosing FHA over conventional financing. Closings in March under $600K saw 21% of closings involving an FHA loan compared to only 9.5% last May, and that was just the first month the new policy was in effect. Conversely, cash sales dropped from 31% of sales last May under $600K to just 18% in March.
Meanwhile, demand picked up over the last month as supply continued to decline. This means continued upward pressure on price, but at a more moderate pace. The last big cities in buyer’s markets - Maricopa and Buckeye - are quickly moving towards balance. Average sales price per square foot has stabilized in these two areas and most cities have seen prices turn back up this year. While year-over-year price comparisons have been negative since December, by July or August they could turn back to positive if the current rate of appreciation is sustained.
Commentary written by Tina Tamboer, Senior Housing Analyst with The Cromford Report
©2023 Cromford Associates LLC and Tamboer Consulting LLC









