
June 2023 Phoenix Real Estate Snapshot
Median Hits $440K, Annual Appreciation Expected to be Positive Again Soon,
Traditional Buyers Rebound After Investors Retreat
For Buyers:
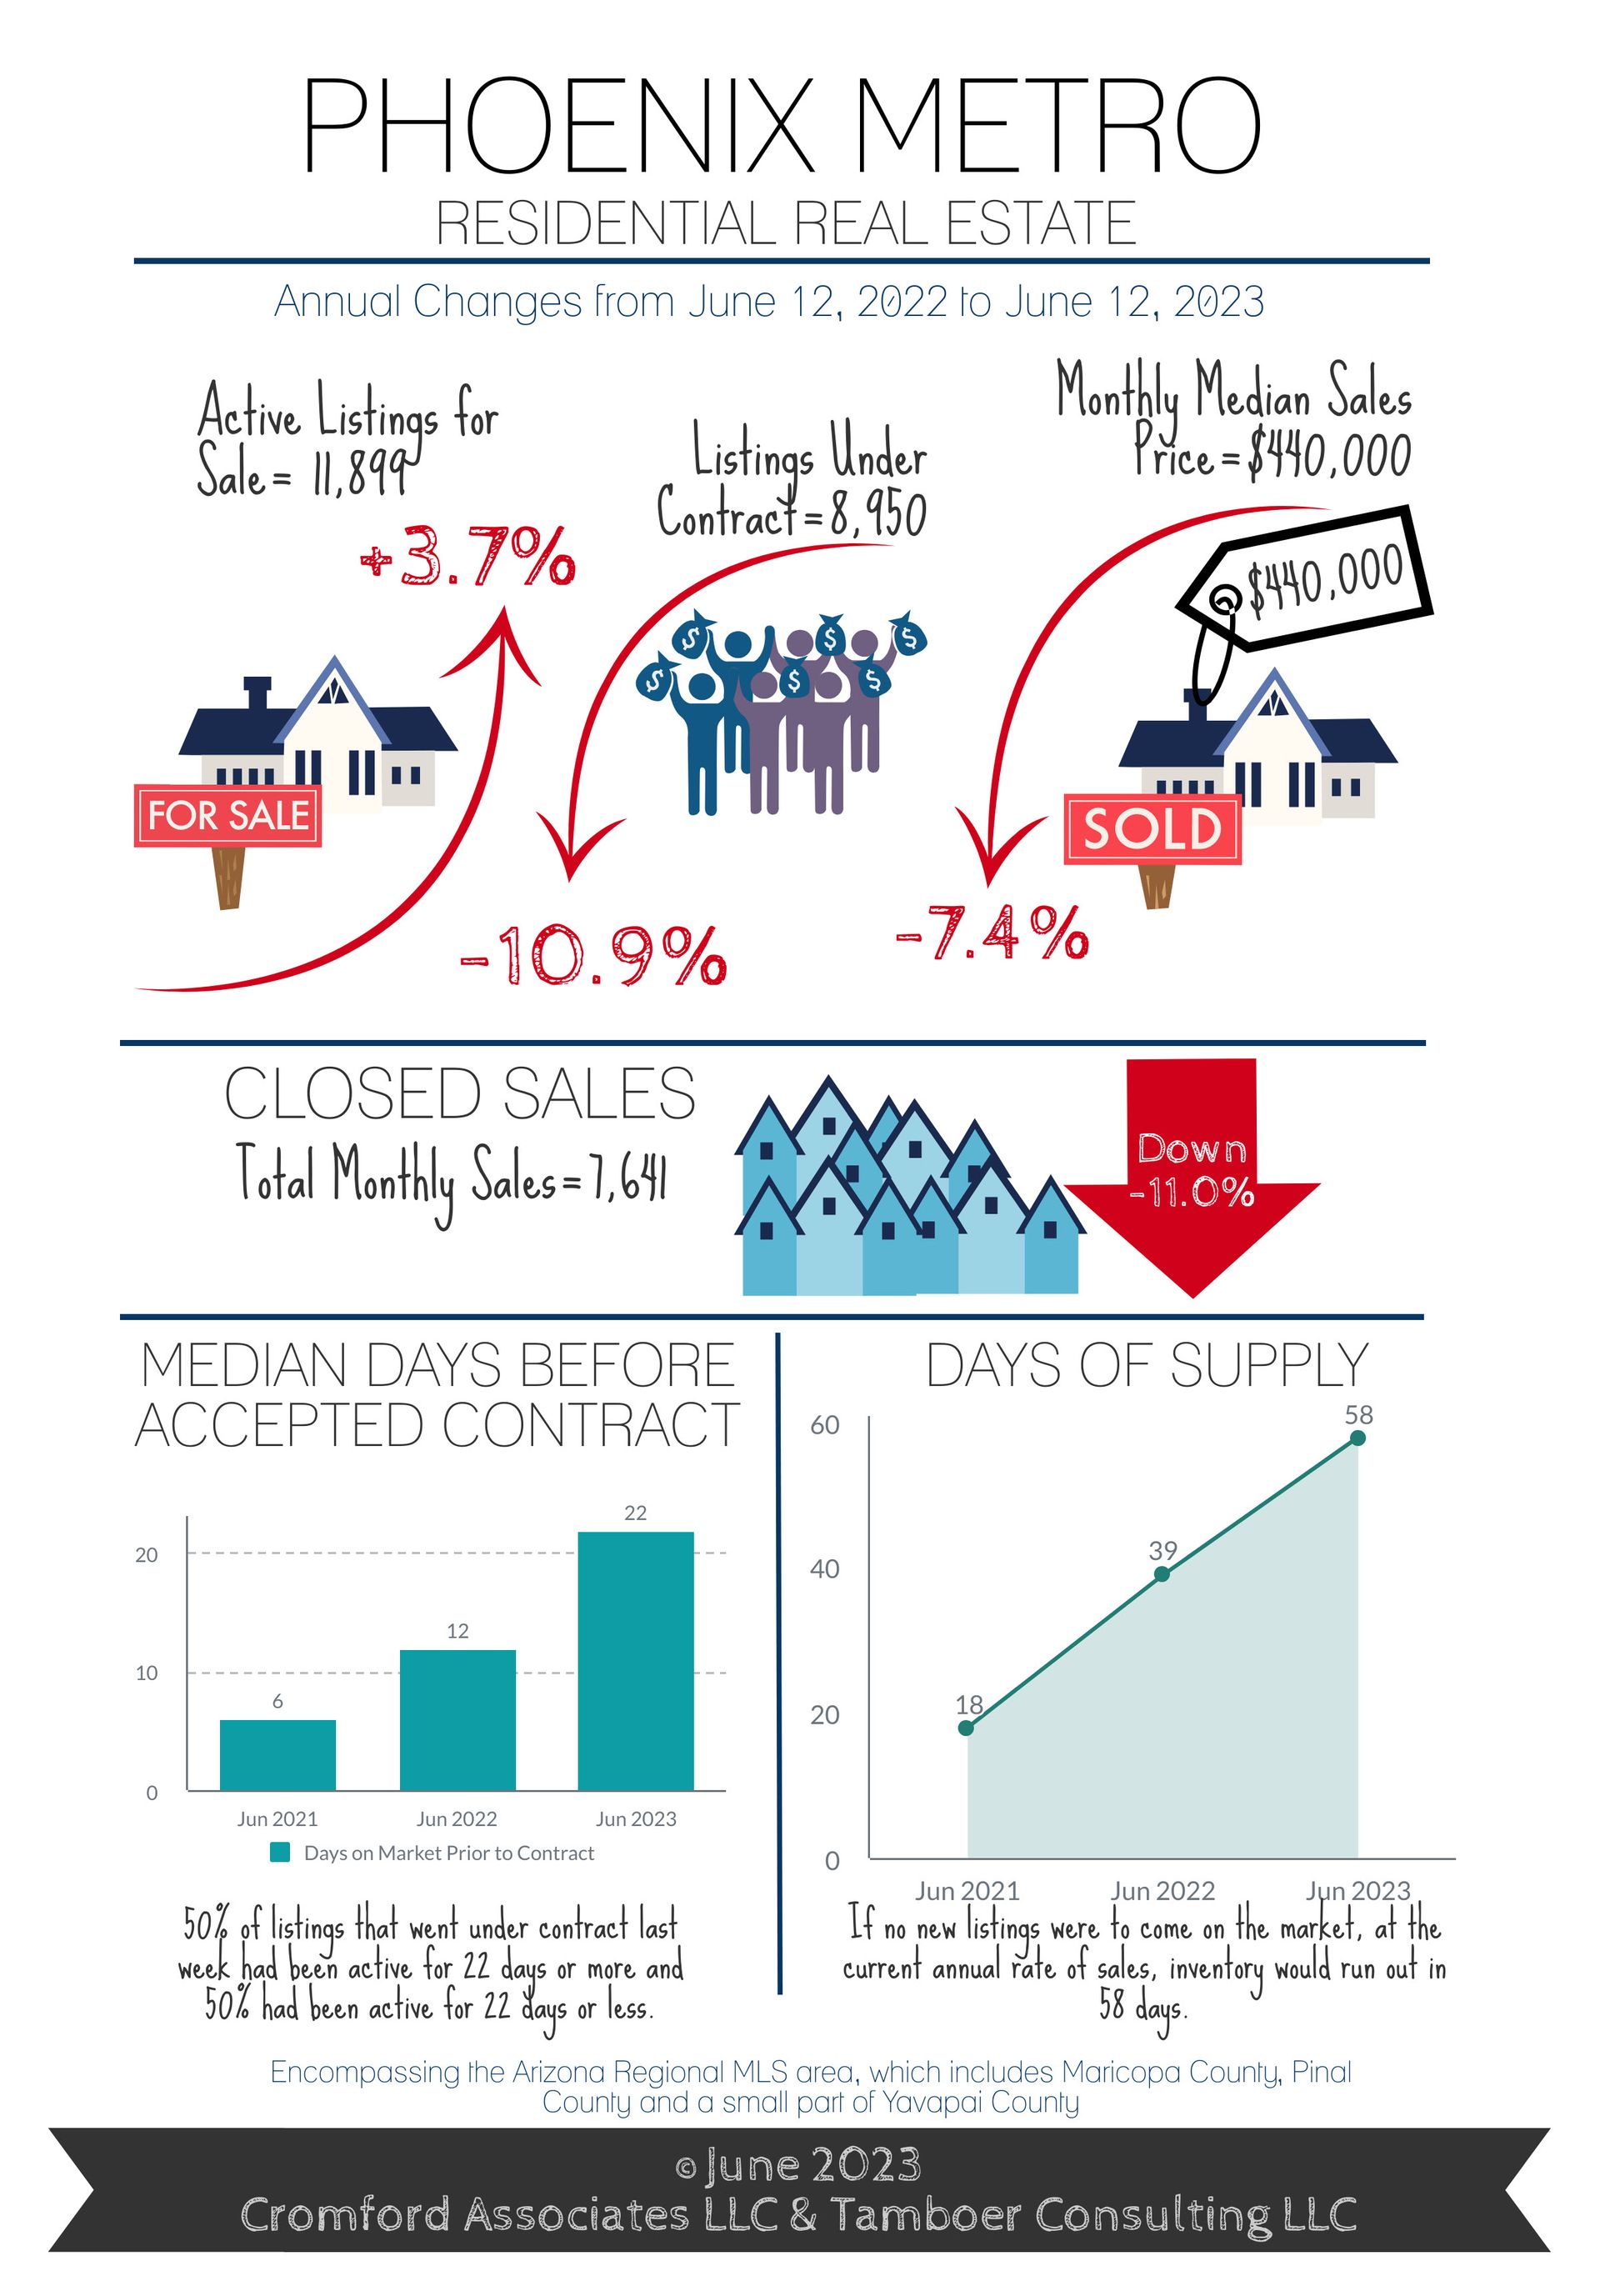
Last month we reported that the year-over-year supply change will be negative within 6 weeks, and at that time supply was 80% higher than the previous year. Now 5 weeks later, supply is only 3.7% higher than last year’s count and is expected to be below 2022 in another week. New listings continue to be insufficient in replacing properties that have gone under contract, resulting in overall supply dropping an average of 151 listings per week within the last month.
That’s a slower rate of decline compared to previous months, but it’s not because more sellers decided to get off the fence and list their homes. The slower decline is in response to demand weakening when mortgage rates increased from 6.5% to 7.1% within 2 weeks last month, the shock causing many buyers to take a breath. Once again, just when housing economists got optimistic in April about mortgage rates stabilizing or declining, less than favorable inflation reports caused them to spike once again. It’s tough to do mortgage rate predictions these days.
Since then, conventional mortgage rates have dropped only slightly, hovering around 6.9%. The downturn in demand has created a noticeable advantage for FHA buyers, who had been mostly rejected by sellers over the past 2 years in favor of cash investors. As investors have retreated back to normal levels this year, putting traditional buyers back in the driver’s seat, FHA increased the amount of money they’re willing to loan to $530K. They also lowered their mortgage insurance premiums by $100s on monthly payments annually. These changes have resulted in the market share of closings in Greater Phoenix funded by FHA to go from just 9% in April 2022 to 22% in April 2023 on sales under $600K.
Sellers are still contributing to closing costs and buying down mortgage rates on behalf of the buyers to make the monthly payments attractive and competitive compared to local rental rates. In May, many lenders upped the game and announced new down payment assistance programs and loans with just 1% down. Each program has separate requirements that need to be explained by a qualified loan officer, but they are often focused on getting first-time home buyers into entry level homes.
You may be surprised when we tell you that does not disqualify many buyers who have previously owned a home. Search the definition of first-time home buyer online and you’ll find that any individual who has not owned their primary residence within the last 3 years is re-classified as a first-time home buyer. Couples also qualify as first time home buyers if one spouse has not owned a home in the last 3 years.
For Sellers:
Despite the increase in mortgage rates and subsequent drop in demand, prices continue to rise in Greater Phoenix and are expected to continue doing so for the next 3-5 months. While still down year-over-year, the median sales price has recovered 5% since our December newsletter, up $22K.
Before the end of the 3rd quarter this year, it’s very likely annual appreciation rates will turn positive once again.
Nearly every city is officially a seller’s market this month. Maricopa and Buckeye are no longer buyer’s markets. They are now in balance and moving towards seller’s markets once again. The only city remaining in a buyer’s market is Casa Grande at this time. When markets soften like they did last year, the cities on the outskirts fall into buyer’s markets first and are the last to come out. Cities on the interior are the last to go into buyer’s markets, and the first to come out. As the interior cities such as Phoenix, Glendale, and Chandler first moved into a seller’s markets in January, the shift of these outlying areas is the final step to coming full circle in the market correction.
Improving market conditions for sellers only slightly relieves the need to contribute to closing costs and rate buydowns for buyers. Over 50% of sales between $200K-$500K involved sellers contributing to buyers’ costs with the median contribution at $7,500 so far this month. That’s down from January’s sales where 62% involved concessions in this price range, at a median cost of $9,300. So while things are improving, make no mistake that Greater Phoenix would not be in an appreciating market if sellers were not willing and able to offset the costs associated with closing on a home.
Commentary written by Tina Tamboer, Senior Housing Analyst with The Cromford Report
©2023 Cromford Associates LLC and Tamboer Consulting LLC









