July 2025 Phoenix Arizona Real Estate Snapshot
Guess Which City Bounced into a Seller’s Market this Month
Where Have Home Prices Dropped the Most?
For Buyers:
Welcome to July in Phoenix where it’s so hot we saw a bird pull a worm out of the ground with an oven mitt. The peak buying season is officially over, and while both supply and demand kicked off with a bang in the first quarter, the second quarter was a dud due to increased mortgage rates and market volatility.
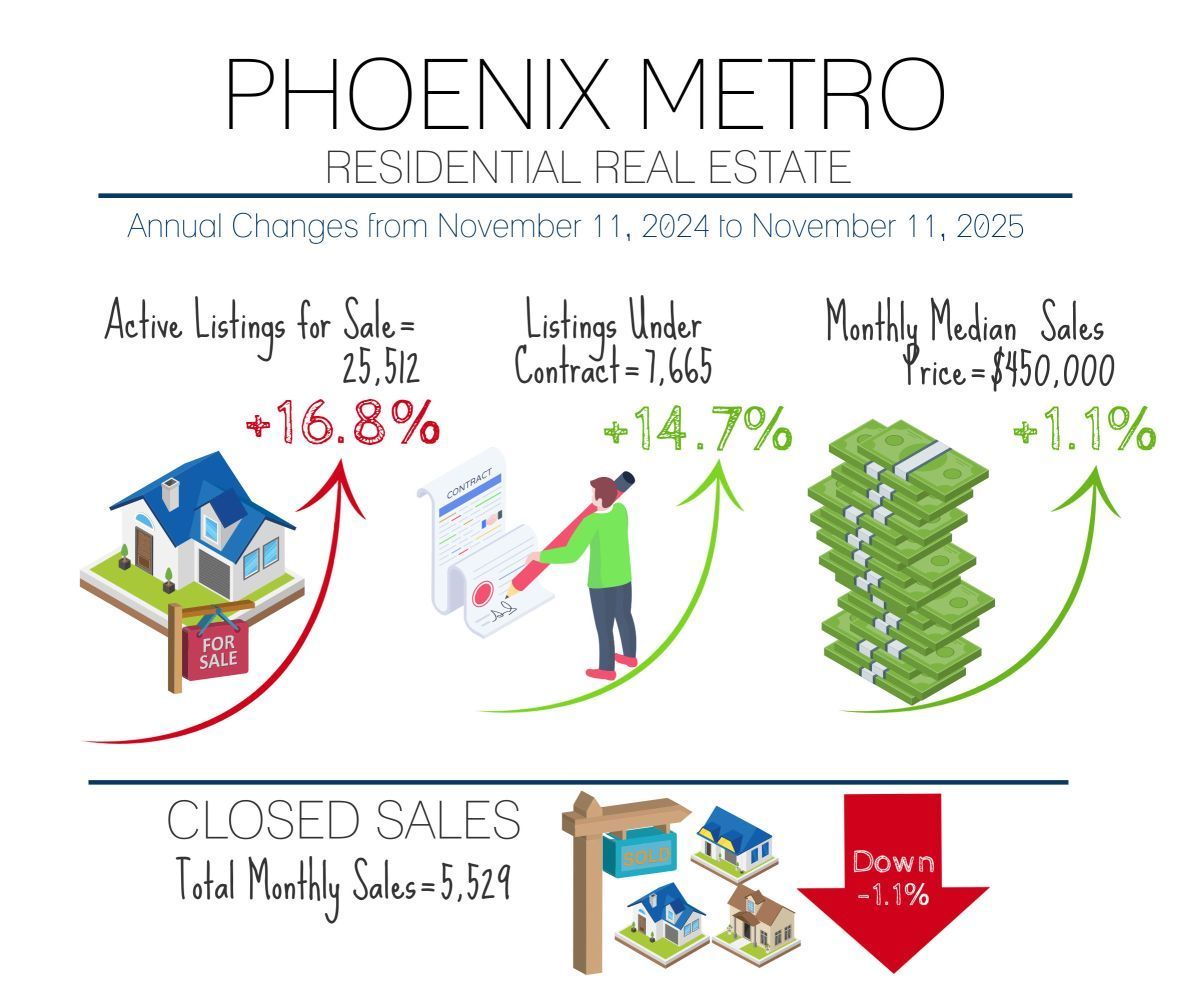
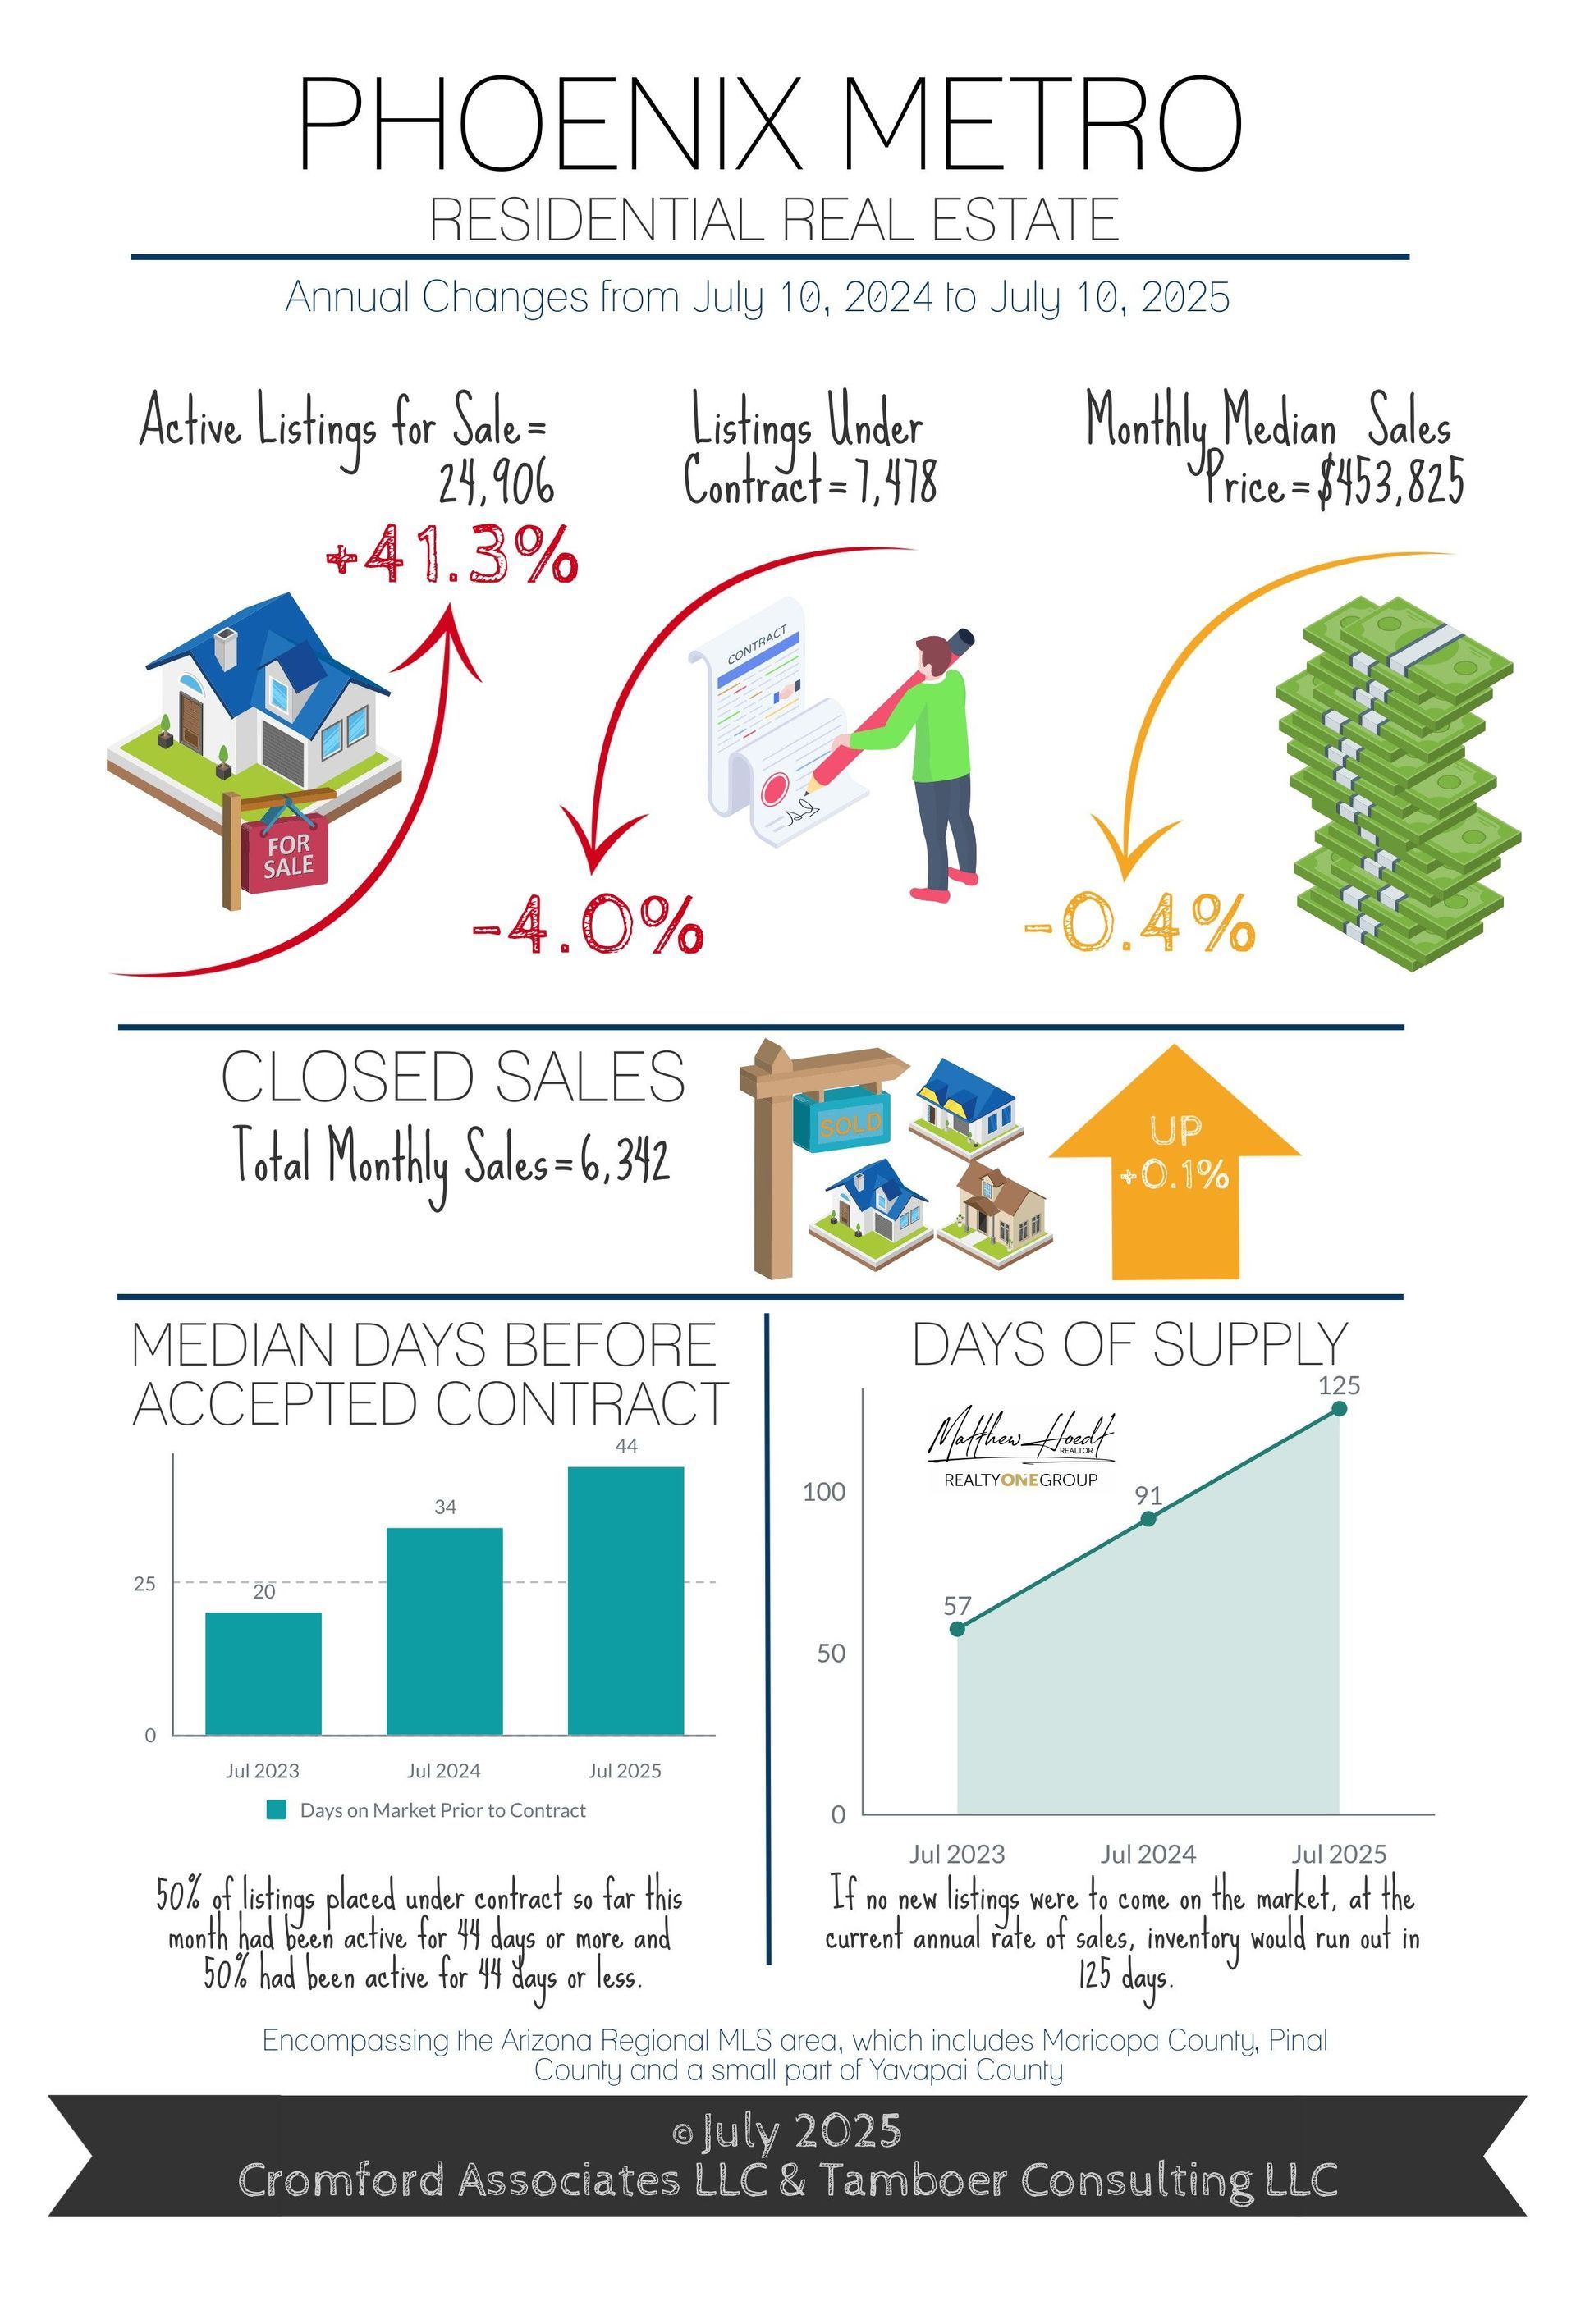
By the end of May, many sellers threw in the towel and decided to cancel their listings or allow them to expire. Cancelled listings were up 46% in June compared to last year, and expired listings were up 79%. At the same time, the number of new listings added weekly to the MLS dropped 24% from week 22 (Memorial Day) to week 27 (Independence Day). All factors combined, the result was an 8% drop in overall supply over the last 5 weeks.
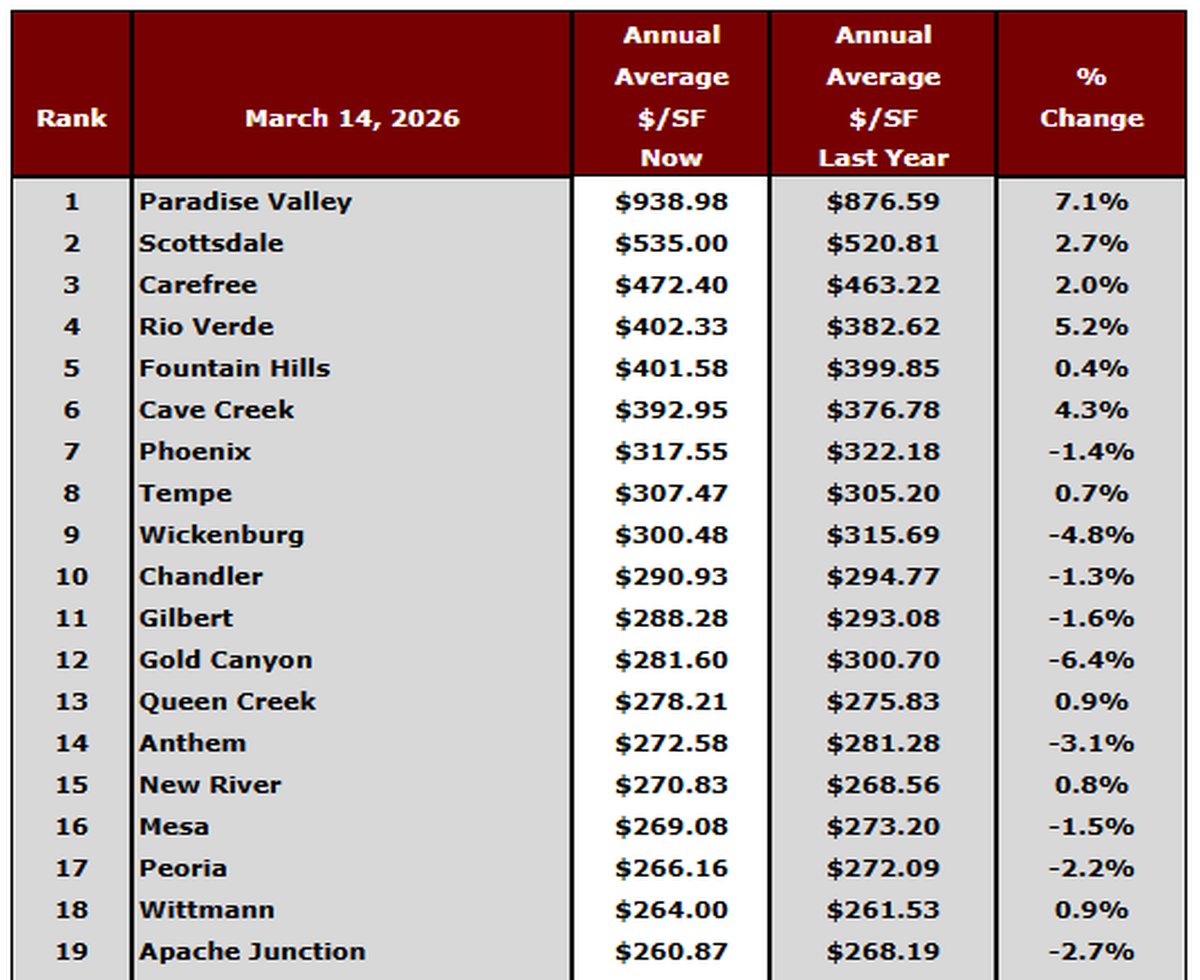
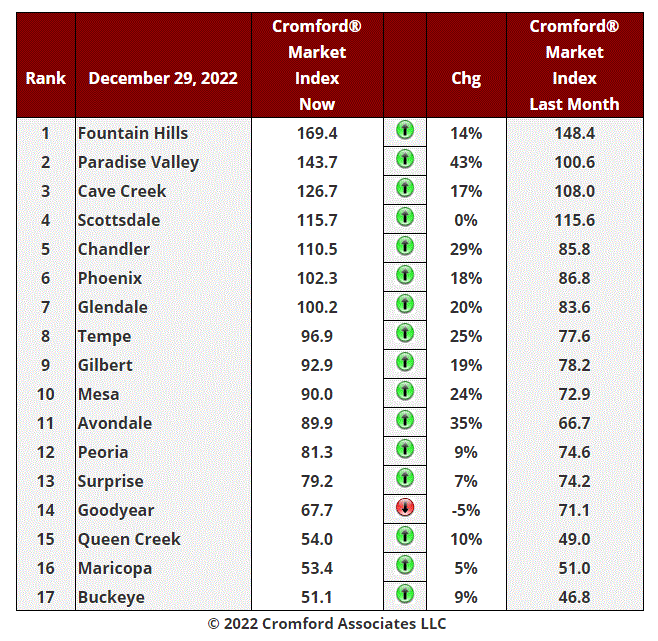
While all price ranges are seeing impact, the largest percentage inventory drop was recorded over $800K with a 14% decline compared with under $800K at a just a 5% drop. The increase in cancelled and expired listings on the high end is expected seasonally as June is typically the peak month for luxury sellers to pull out, but not to this degree. For example, Paradise Valley dropped 39% in active supply over the past 6 weeks, but contracts in escrow only dropped 5%. Ironically, this pushed Paradise Valley out of a balanced market and into the 3rd strongest seller’s market this month, the opposite of what most would expect during the heat of a Phoenix summer.
As for the lower end of the market, single family homes between $250K-$300K are up 38% in June sales, with a nice bounce in new contracts over the week of 4th of July. Single family homes between $300K-$400K are up 10% in sales. Both of these price ranges have seen prices drop an average of 3.5% since last year. Condos in the same range have dropped 5.5% in price and are down 11% in sales compared to last June. Mid-range homes in the $500K-$800K range are seeing unremarkable changes in both price and June sales volume.
As prices continue to drift down in this buyer’s market, contract activity is expected to improve compared to last summer.
For Sellers:
It’s business as usual for sellers as 55% of sales closed last month with sellers contributing a median of $10,000 to the buyers’ closing costs, and negotiations averaging 97.1% of list price. Sales volume is about even with last year, but supply is still up 41% despite recent declines over the past few weeks, keeping sellers at a disadvantage in most areas. This means that many prices are coming down.
The median time on market prior to an accepted contract is 44 days, unless you’re selling a condo or townhome, then it’s 59 days. While buyers are negotiating to 97.1% of the last list price, it’s not consistent across all price ranges and property types. Lower price ranges will often see less of a negotiation on price and more on closing cost assistance, repairs, and upgrade requests. Upper price ranges negotiate more off of the price.
For example, single family homes between $300K-$400K are negotiating within 99.1% of list, but closings of condo/townhomes in the same price range are within 97.7% of list. That can be a difference of $4,000-$6,000 in price negotiations because there are fewer large negotiating items in a condo compared to a single family home. Single family homes in the higher price ranges over $1M are seeing negotiations within 95%-96% of list.
Large negotiation gaps don’t necessarily mean sales prices are declining and small gaps don’t mean prices are rising. Sellers always list high to get the most out of the sale; sometimes the market obliges them and sometimes it denies them. The gap between the original list price and the final sale price, which can involve both price reductions and negotiations, is simply the difference between a seller’s expectation of price and what the market is willing to bear. Buyer’s markets are less obliged to grant sellers their price wishes.
June sales prices for properties under $400K were down an average of 4.5% from last year. The $400K-$600K range was down 2.4%. Mid-range prices from $600K-$1.5M were flat within 0.1%-0.8% over last year, and higher-range prices over $1.5M where buyers negotiate harder on price are up 4.4% on average in appreciation.
Commentary written by Tina Tamboer, Senior Housing Analyst with The Cromford Report
©2025 Cromford Associates LLC and Tamboer Consulting LLC