
September 2025 Phoenix Arizona Real Estate Snapshot
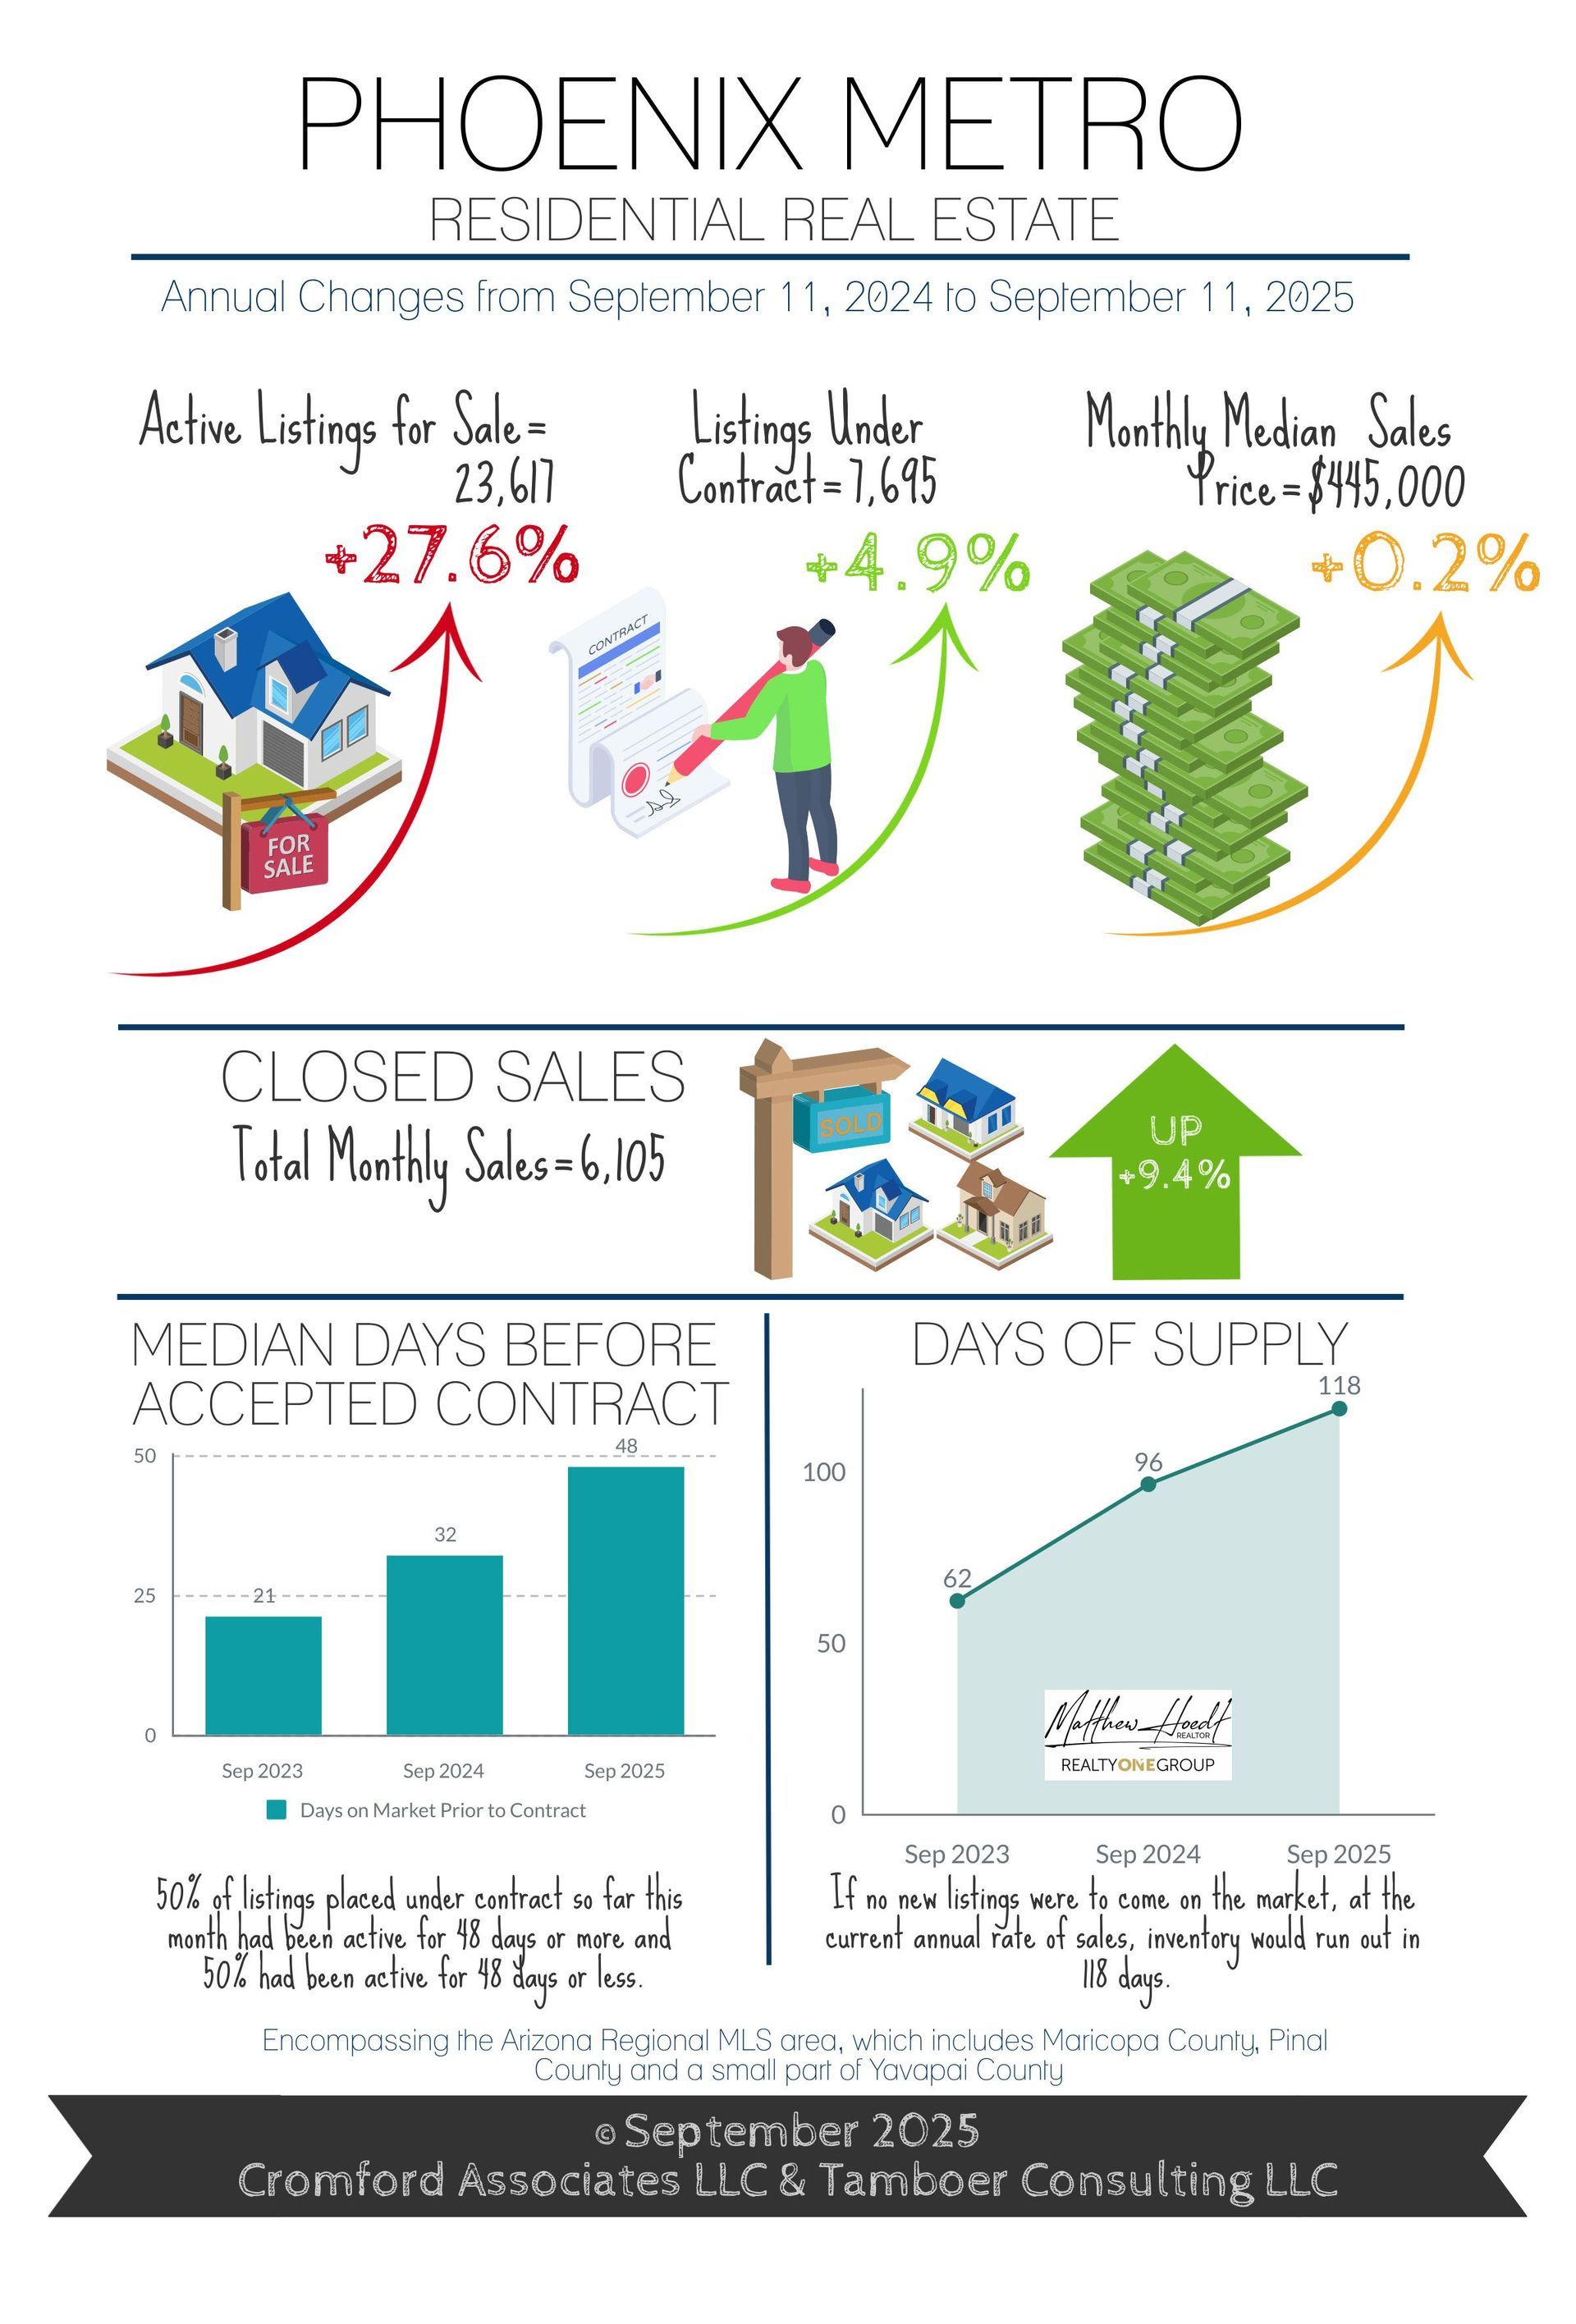
Payments Drop 12%, Monthly Sales Up 9.4%,
As the Market Turns: Could a Recession be Good for Housing?
For Buyers:
Be aware, the market is turning. Reading the Cromford® Market Index (CMI) for Greater Phoenix, a measure under 90 is a buyer’s market and 90-110 is a balanced market. Our index has been indicating a buyer’s market since November 2024 and hit bottom at a measure of 72 before turning mid-July. Two months later, as of September 11th, the CMI is up 9 points to 81. At this rate, it could surpass 90 and enter a balanced state by November, potentially ending a year-long buyer’s market and stabilizing prices.
Buyers may not have as much time as they think to purchase under the favorable negotiating conditions of a buyer’s market. Asking prices for homes have been declining for 4 months, but appear to have stalled over the past week. Mortgage rates in January were 7.26% per Mortgage News Daily, and on September 11th they averaged 6.27%, nearly a full percent change. Meanwhile, active mid-range listings between $300K-$600K have dropped nearly 2% in asking prices. What does this mean?
Let’s do the math. With every 1% drop in mortgage rate, all principle and interest payment measures across all loan amounts drop by 10%. So if a buyer was quoted a $2,400 monthly payment in January on a $350,000 loan at 7.26%, that PI payment would be $2,160 at 6.26%, saving $240/month. Combine that with a 2% drop in the asking price of the home, that saves another 2% off the payment, bringing the total savings to $288 and a payment of $2,112, a 12% discount compared to January.
That’s not all. In this buyer’s market, more than 60% of sales between $225K-$600K have sellers paying for the buyer’s closing costs, which often include a 2/1 rate buydown. This drops the buyer’s payment by another 20% in the first year, and 10% in the second, bringing the first-year payment down to $1,690 and second-year payment to $1,900 before taxes and insurance.
Over the next few months, sales prices will begin to show the decline active list prices have already endured. However, if mortgage rates stay low and the Cromford® Market Index continues to climb out of a buyer’s market, buyers may see their negotiating advantage dwindle. For now, all properties are officially “on sale”.
For Sellers:
Headlines on the economy are pretty scary these days with recession predictions reaching as high as a 93% probability from UBS last week. These are based on a continuous stream of weak jobs reports and an increase in the unemployment rate to 4.3% reported on September 5th. Ironically, history tells us that as the labor market weakens and recession looms, mortgage rates improve and homebuyer demand increases. In fact, in Greater Phoenix home sales actually increased over the 2001, 2008, and 2020 recessions despite high unemployment. How can this be?
As fears of a recession rise with unemployment, demand for bonds increases as people move their funds to safety. This pushes the 10-year treasury rate down, which in turn pushes the 30-year mortgage rate down. Even with higher unemployment, the vast majority of people are still working. Those who are stable in their employment see an increase in their ability to qualify when mortgage rates decline and are motivated to explore their options, thus increasing demand.
Buyers are not the only ones that get excited over lower mortgage rates, sellers do too. This means that while demand is increasing, more listings than expected could hit the market initially and create a speed bump for the Cromford Market Index on its way to a balanced state. This is something to watch for over the coming months. Additionally, the 4th quarter is rarely the best time to be a seller seasonally. While lower mortgage rates are improving demand compared to last year, buyer demand drops significantly over the holidays in November and December.
Finally, while recessions can activate the mainstream housing market, they will stall the luxury and retirement communities. These segments do not rely on mortgage rates (often paying with cash) and are influenced more by the performance of their investment portfolios, which tend to suffer in a recession.









