
August 2025 Phoenix Arizona Real Estate Snapshot
New Contract Activity Bounces after July 4th,
Active Supply has Been Reduced 14% since April
For Buyers:
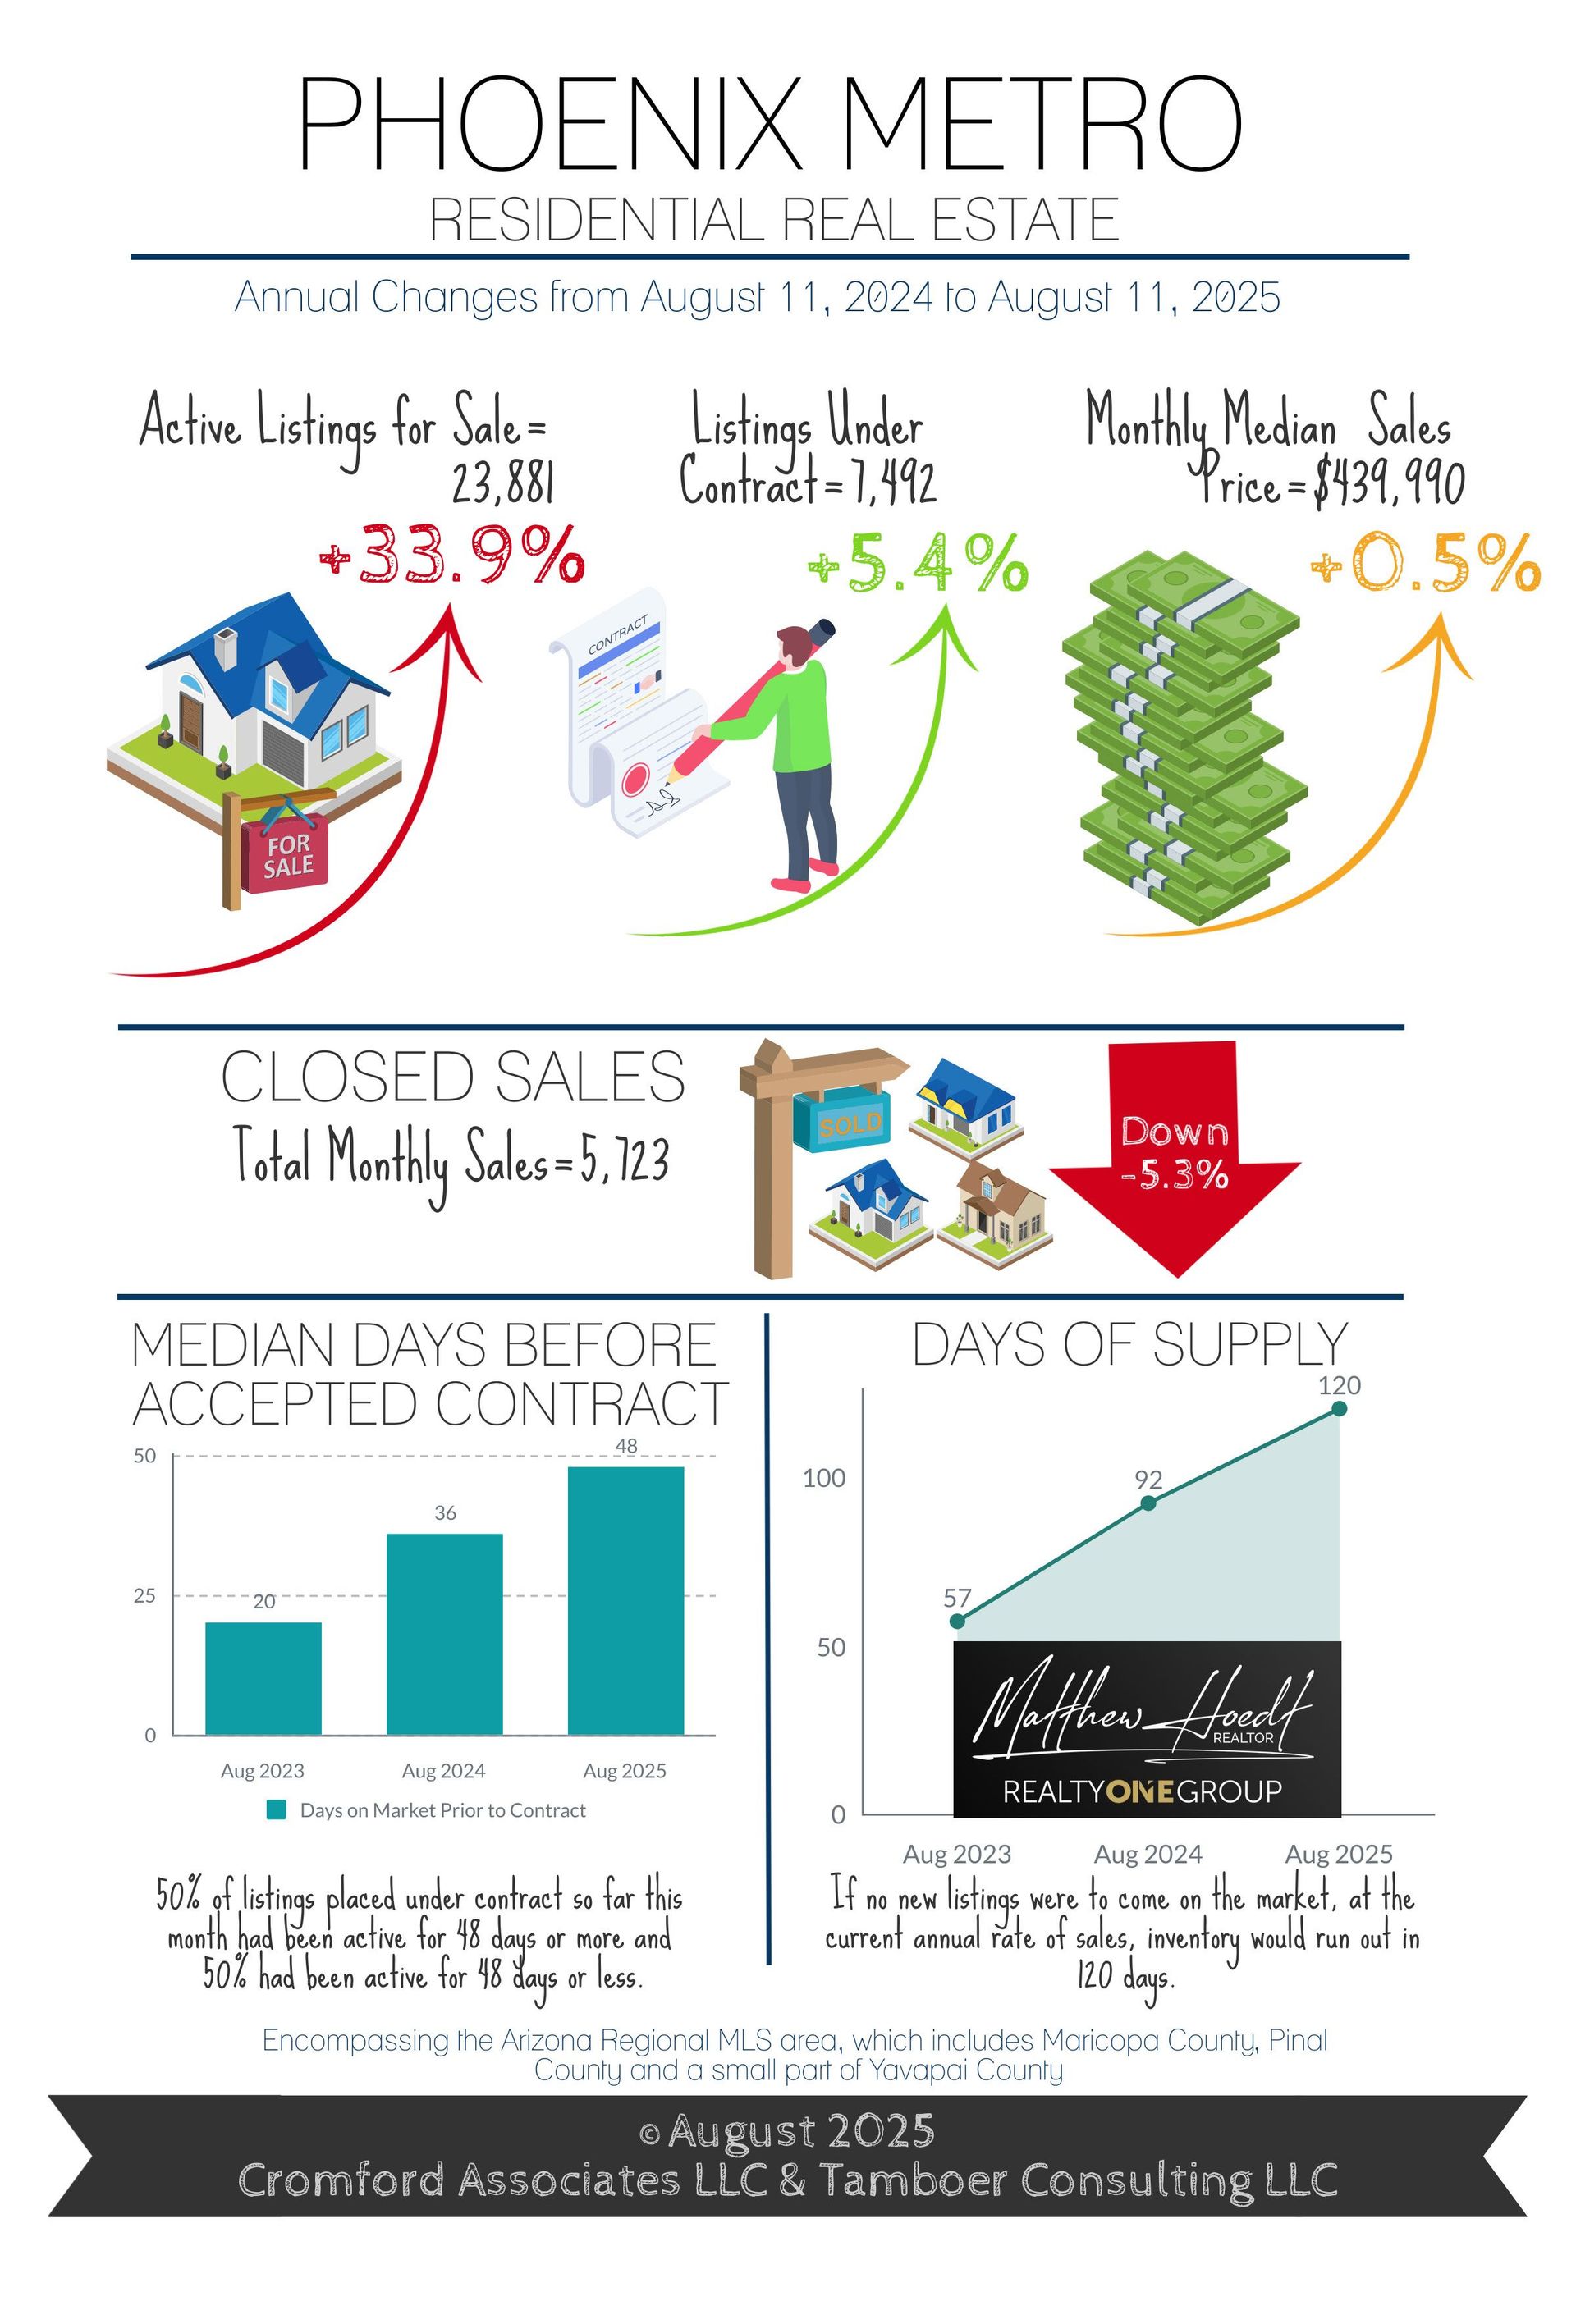
Since April, active supply levels have now declined 13.6% due to a large increase in cancelled and expired listings from May through July and too few new listings to replace them. July cancellations were up 64% over last year and expired listings increased 69%. Demand for homes has also begun to recover, helped by a drop in mortgage rates from 6.75% to 6.55% and a 14% increase in weekly accepted contracts since the 4th of July.
Despite the median sales price showing a flat trend over last year, asking prices are steadily declining when analyzed by price per square foot. Sellers contributing to their buyer’s closing costs and rate buydowns hit 56% of sales, and so far August concessions are hitting a record high of 58% of sales.
The largest declines in asking prices have been seen in condominium/townhomes under $500K, which are down 5.9% under last year compared to single family homes under $500K, down just 1.3%. Within the same price range, buyers negotiated down an extra 2.5% off of the last list price on condo/townhomes and another 1.3% on single family homes in July.
While things are looking very good for buyers right now, the Greater Phoenix market is no longer falling farther into a buyer’s market. Over the past 30 days, the Cromford Market Index started to reverse course as a direct result of lower supply and stabilizing demand. This could mean the days of this buyer’s market could be numbered if it continues at its current pace. Buyers who would like the benefit of seller incentives and zero competing offers for homes should probably get in the game. As affordability improves with reduced mortgage rates and lower home prices, more buyers will enter the market and sellers will be under less pressure to concede to every buyer demand.
For Sellers:
While metrics are improving for the Greater Phoenix housing market, it’s still in a full blown buyer’s market so sellers should remain patient when it comes to days on market. July and August so far are seeing a median marketing time of 48 days prior to an accepted contract, the highest for July in at least 11 years, and the count typically doesn’t get any lower between now and the end of the year. Marketing times are especially brutal in the condo market with a median of 69 days prior to contract, the highest recorded for any month in at least 11 years. Even condos under $250K are seeing a median of 79 days.
Even as the buyer’s market is easing up in the metrics, price will not see a bottom until 3-6 months after the Cromford Market Index re-enters a balanced state. If that were to happen in October or November, for example, then the bottom of price will emerge around February or March give or take. If sellers decide to wait, the good news would be more activity, their home may sell a little faster, and fewer will have to pay for the buyer’s closing costs. The bad news for sellers would be that they’ll most likely be getting a lower price for their home than if they sold today, so the money they save in closing costs could be a wash. Prices will not show much appreciation until the market re-enters a seller’s market, and that isn’t on the horizon at this time.
But there is hope, ironically. National economists are beginning to release higher expectations of a potential recession coming, with large banks such as Chase, Goldman Sachs, and Deutsche giving a range of 30-43% chance in the near future. This puts more pressure on the Federal Reserve to lower the Federal Funds Rate and stop reducing their securities holdings at their September meeting. The big number to watch is unemployment. If that begins to rise too sharply, then the Feds will ease up on their monetary policies, money will flow into bonds for safety, and mortgage rates will fall again. With home prices already down, that would lead to more contract activity in the fourth quarter and hopefully some relief for tired sellers. No one likes an economic recession, but it may need to happen to turn the housing market around faster.









