
June 2025 Phoenix Arizona Real Estate Snapshot
Active Supply Declines in May, Luxury Bounces
Housing Affordability is Getting Better
For Buyers:
There are three main measures that affect housing affordability: mortgage rates, home values, and income. In the past when home values rose too fast for incomes to catch up, it was mortgage rates that adjusted and brought payments back into range, but in this cycle rates have proven to be an unreliable, volatile ally.
The housing industry has been waiting three years for mortgage rates to decline and save the day, and as more time goes by without relief, the more pressure there is on home prices and incomes to adjust in order to increase demand. It is finally happening.
Recent reports from the Federal Reserve of Atlanta state that wage growth grew nationally at a rate of 4.3%, higher than the current 2.4% rate of inflation. Meanwhile in Phoenix, the Business Journals reported a whopping 9.3% wage increase from 2024 to 2025. Combine that with the local Phoenix rate of inflation at 0.3% and that means workers get to keep the majority of their wage increases.
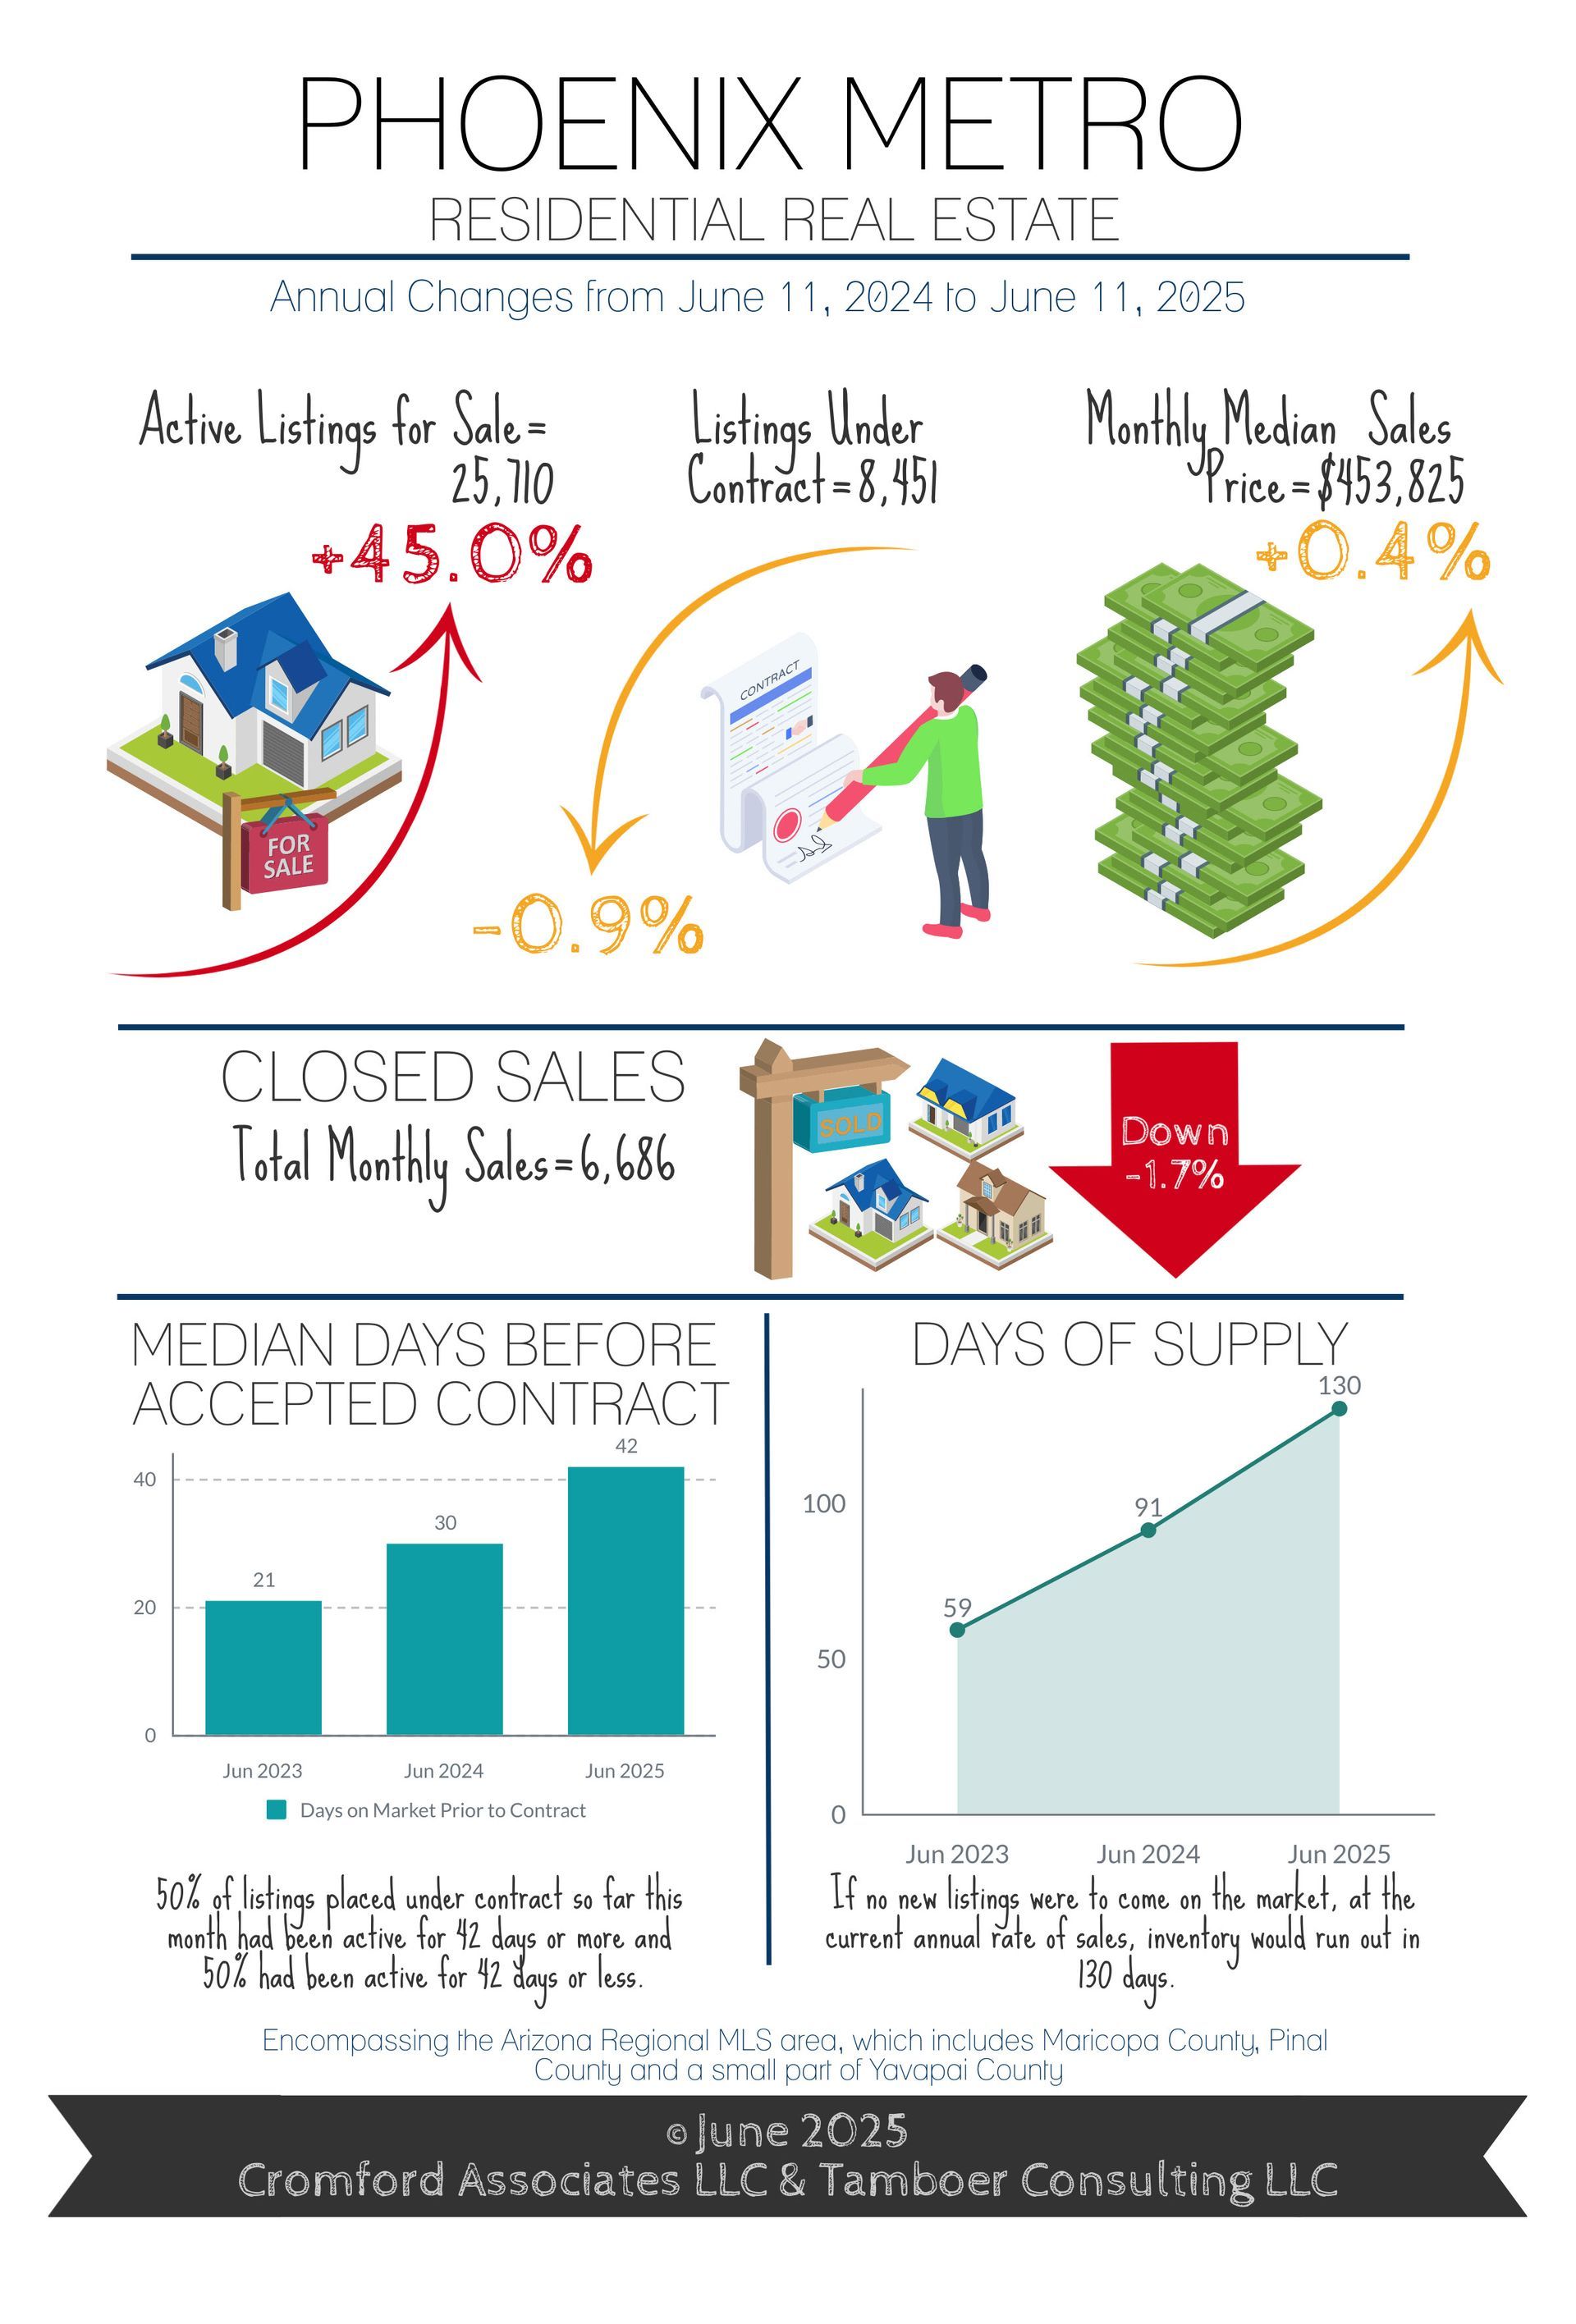
Meanwhile, Phoenix is entering its 8th month as a buyer’s market. Overall price appreciation is flat, within 1% of last year and lower than the 2.4% rate of inflation, with expectations that it may start gliding slowly down over the next few months. Affordable properties under $500K (which made up 58% of sales last month) have already seen prices drift down 2.2% year-over-year.
The combination of increased wages, low inflation, and declining price measures in the most popular ranges means affordability is improving without a massive decline in mortgage rates. It is also creating an environment where buyer contract activity could increase sharply if mortgage rates were to adjust downward over the summer.
For Sellers:
Sales were down in May compared to last year, but consider it a temporary hangover from April. The announcement of surprise tariffs at the beginning of April led to volatility in both the stock market and mortgage rates, which led to lower contract activity for the following 3 weeks before buyers snapped out of it and got back into the game. Fewer accepted contracts in April led to fewer sales in May.
Consumer sentiment was dismal in April, but improved significantly in May citing a more upbeat outlook on business conditions, jobs, and incomes. This outlook was also reflected in the purchase mortgage applications index, which rose sharply to 18% over last year’s index measure and higher than it’s been in 2 years. This is a positive indicator for summer contract activity and sales.
The luxury market received some good news in May as crypto and stock portfolios bounced back from March and April lows, corporate profits for Q1 were strong, and exchange rates returned to normal for international buyers. The result was an unseasonal bounce in weekly accepted contracts over $1M, up 30% over 4 weeks. This is unusual since high end contract activity typically declines in May as temperatures pop over 100 degrees.
Meanwhile, more sellers have decided market conditions are too unfavorable for them and are taking a pause. While supply is still up 45% from last year, the last 7 weeks have seen a 3.4% decline. New listings added to the MLS every week has dropped 39% over the last 2 months, and are now at the second lowest level historically (2023 was the lowest year for new listings). Weekly listing cancellations are up 38% over last year, and expired listings in the last week of May were up 84%. In the past, cancelled and expired listings were re-listed right away and didn’t affect the total count, but this time sellers are taking a longer break and sometimes opting to rent their homes instead.
While cancellations are up across all price points and property types, for those in the luxury market June is the peak month for cancellations and sometimes (ironically) there can be a bigger drop in active listings than in buyer activity over the summer. More luxury listings typically hit the market again in October once temperatures drop below 100 degrees, but buyer activity doesn’t always rise with them over the holidays. For this reason, it’s not a bad idea to list a luxury property after June, even if it’s just to test the market for a few months and get valuable buyer feedback.
Commentary written by Tina Tamboer, Senior Housing Analyst with The Cromford Report
©2025 Cromford Associates LLC and Tamboer Consulting LLC









