
July 2023 Phoenix Real Estate Snapshot
Mortgage Interest Deduction Saves Money for New Homeowners
Home Values Appreciated 5-7% Since December
For Buyers:
While many professionals tout appreciation as the main benefit of homeownership, higher mortgage rates bring another tool into the equation that hasn’t been promoted in well over a decade. That is the mortgage interest tax deduction. This deduction hasn’t been a selling point for many years because prices and mortgage rates had previously been so low that mortgage interest payments rarely surpassed the annual standard deduction for most households.
The 2023 standard tax deductions are $13,850 for a single filer, $20,800 for head of household, and $27,700 for married filing jointly. When a household goes from renting a home for $2,200 per month to purchasing a home with a principal and interest payment of $2,275*, an average of $1,940 per month of the first year’s amortized payments will go towards interest. This amounts to a deduction over $23,000 off their taxable income. The other $4,000 in principal goes right back into the equity of their home for their benefit when they choose to sell.
For those households with few deductible expenses and high incomes, purchasing a home could make a notable impact on one’s tax bill compared to renting. Here is a very basic example for comparison purposes. A single high-income renter making $100,000 annually using the standard deduction of $13,850 would owe approximately $18,953 in taxes at the end of the year. If they were a single homeowner using the $23,000 deduction in mortgage interest through itemizing, they would owe $16,940, a savings of $2,013 in annual taxes.** Therefore, a monthly P&I payment of $2,275 benefits a household in equity and tax savings more than a $2,200 rent payment in this scenario.
For Sellers:
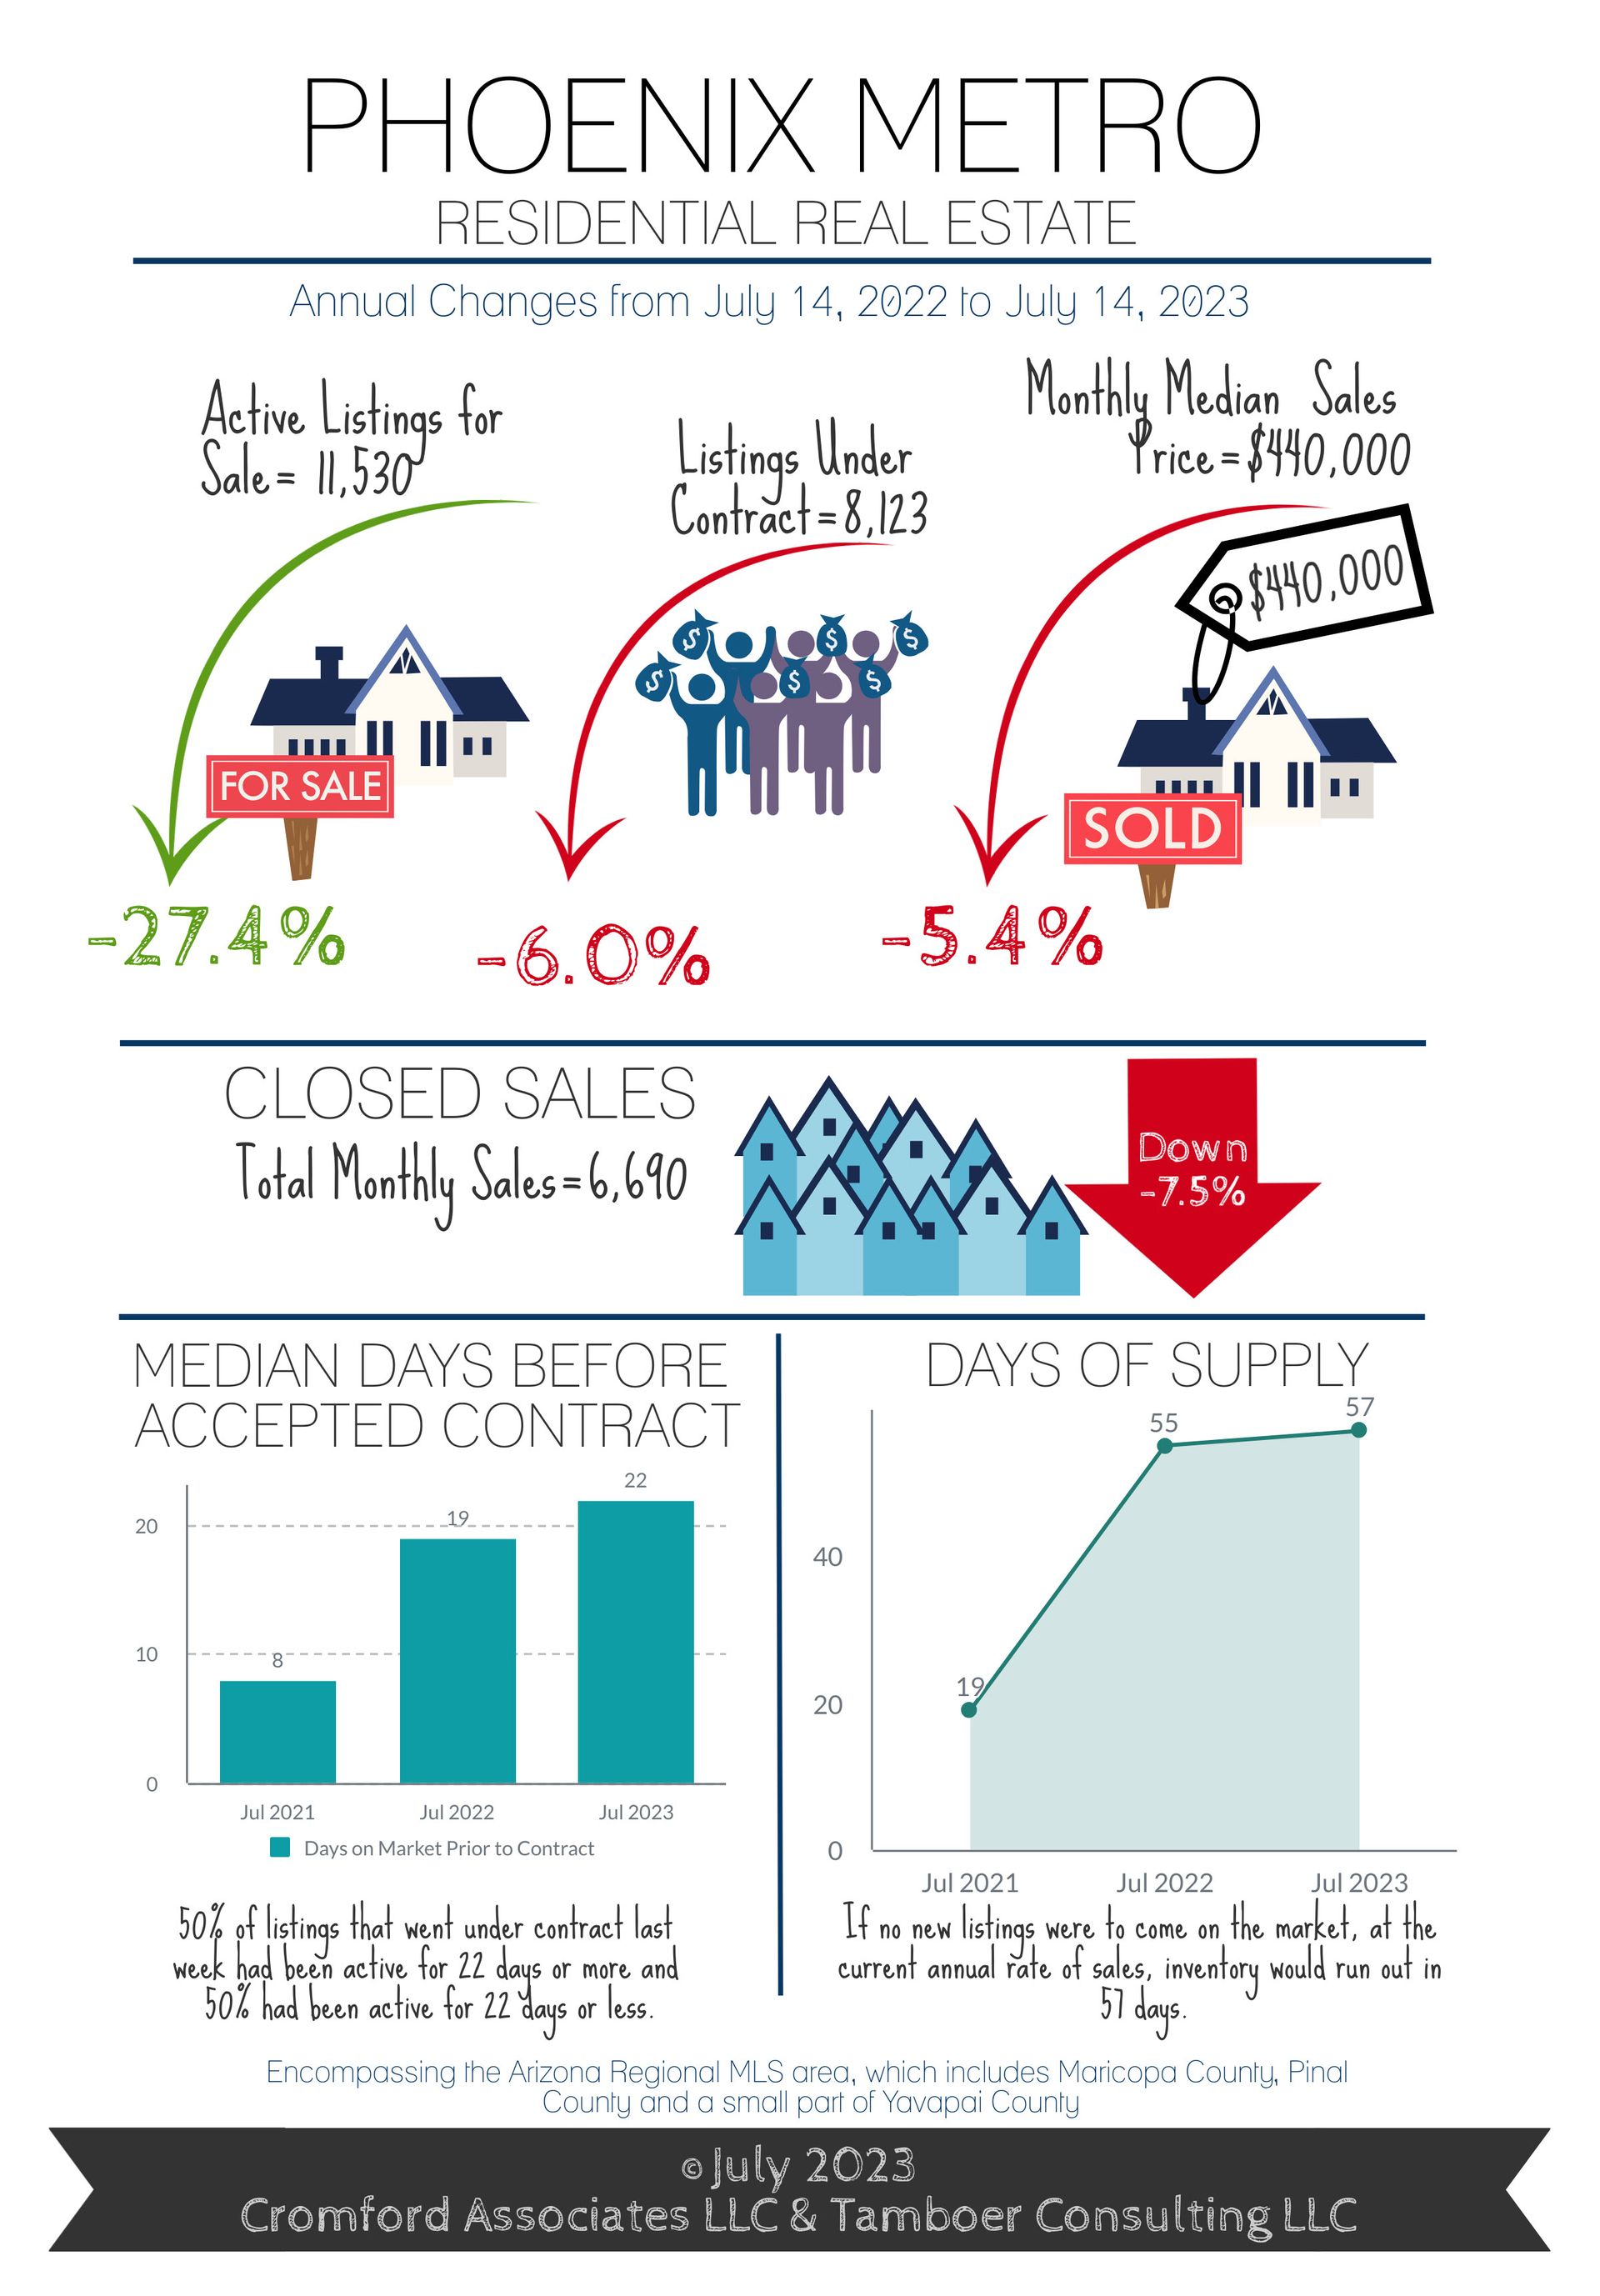
As predicted in last month’s issue, active supply for homes is now officially –27% below what it was this time last year and -38% below the peak of October 2022. Market indicators tell us that prices will continue to rise over the next 3-5 months, but not at an alarming rate. Average price per square foot measures have been elevated this year due to the 3rd best season for luxury sales over $1M, and especially over $3M. However, the entire luxury segment goes sleepy once temperatures go above 100 degrees. As a result, overall price measures often stagnate, or even decline, from July to September for no other reason than there are fewer high-end closings. Once luxury sales over $1M are removed from the trend line, price appreciation from December through June goes from +7.7% to +4.9%.
The first half of 2023 has proven much better than the last half of 2022 for home values by far. A normal rate of appreciation established between 2015 and 2019, prior to the COVID-19 pandemic, is between 6-8% annually. This puts the current rate of appreciation since December higher than normal when extrapolated through the end of the year.
There has been significant reporting of the “locked-in” effect across the nation; homeowners with 30-year fixed mortgages at or below 3% who have little incentive to move up or down due to higher mortgage rates. This is a blessing, not a curse. Not all countries have long-term fixed-rate mortgages like the United States. For example, the bulk of Australia’s mortgage holders have variable rates that adjust every 1-5 years. As rates have increased substantially, sellers unable to afford their adjusted payments become distressed and forced to sell. This is the environment that causes home values to decline, but that is not happening in the United States since existing homeowners are not forced into higher payments when rates increase.
Over 57% of resale sellers in Greater Phoenix have owned their homes for more than 3 years, property values have appreciated 40% or more over that time and are maintaining. The level of buyer demand continues to be fueled by our sellers’ ability and willingness to contribute to rate buy-downs and closing costs. 42% of June closings involved some form of closing cost assistance from sellers with a median cost of $8,000, with the prime price point being sales between $200K - $500K. That same price range happens to have 20%-30% of sales over asking price as well, with a median between $5,000-$5,500 above list; reflecting many buyers’ willingness to meet sellers halfway.
*P&I payment calculated for a $400,000 purchase, 10% down, 6.5% interest rate. Does not include PMI, taxes, or homeowner’s insurance.
**Always talk to a qualified, professional tax accountant for personalized, detailed tax advice. Check out https://www.irs.gov/pub/irs-pdf/p936.pdf for more information on the mortgage interest deduction.
Commentary written by Tina Tamboer, Senior Housing Analyst with The Cromford Report
©2023 Cromford Associates LLC and Tamboer Consulting LLC









