
January 2024 Phoenix Real Estate Snapshot
It’s Back! Greater Phoenix is in a Seller’s Market Again
When the Mortgage Rate Drops 1%, the Payment Drops By….
For Buyers:
Well the balanced market didn’t last long, 7 weeks to be exact. Last month the Federal Reserve gave the housing industry a much needed gift. Not only did they not raise the Federal Funds Rate, they also announced their intention to drop it three times in 2024. Conventional mortgage rates responded by dropping from 7.1% to 6.62% within 2 days. Mortgage rates have now dropped 1.4% since they peaked at 8% in October 2023, saving a borrower nearly $380 per month on a $400,000 loan, a payment decline of 13%. For perspective, each time the rate drops by 1%, the mortgage payment can drop between 9-10% depending on where it started, in many cases saving at least $200/month*. This rate drop was enough to give December’s mortgage applications a boost, which could be a precursor to January’s accepted contract counts.
In addition to the savings from declining mortgage rates, December ended with 49% of sales involving a seller-paid concession to the buyer at close of escrow, at a median cost to the seller of $10,000. Coolidge had the highest percentage of sales with concessions at 81%, followed by Laveen at 79%. Coolidge has a median sales price of $305,000 with the majority of sales being new construction. Laveen has a median sales price of $436,000, also with a majority of new construction. You’ve probably already picked up on the trend here. Over 76% of all newly constructed home sales that closed through the Arizona Regional MLS noted some form of builder-paid concession. If they were sold for under $500,000, that percentage rises to 82%. The majority of concessions go towards further buying down the buyers’ mortgage rate, temporarily or permanently.
So what can Greater Phoenix expect for 2024? It’s reasonable to expect some relief, not in the form of declining prices but in declining mortgage payments. Combine this with rising family incomes and we can expect affordability measures to improve along with demand. It’s not reasonable to expect another insane market with skyrocketing prices like 2020-2021, or another 12.5% drop in values like 2022. It could be quite boring in terms of price for the first quarter, but uplifting with more traditional home buyers getting back in the game. Things could get more exciting after the Federal Reserve meets again at the end of January and further reveals their plan for the Federal Funds rate in 2024. Stay tuned.
For Sellers:
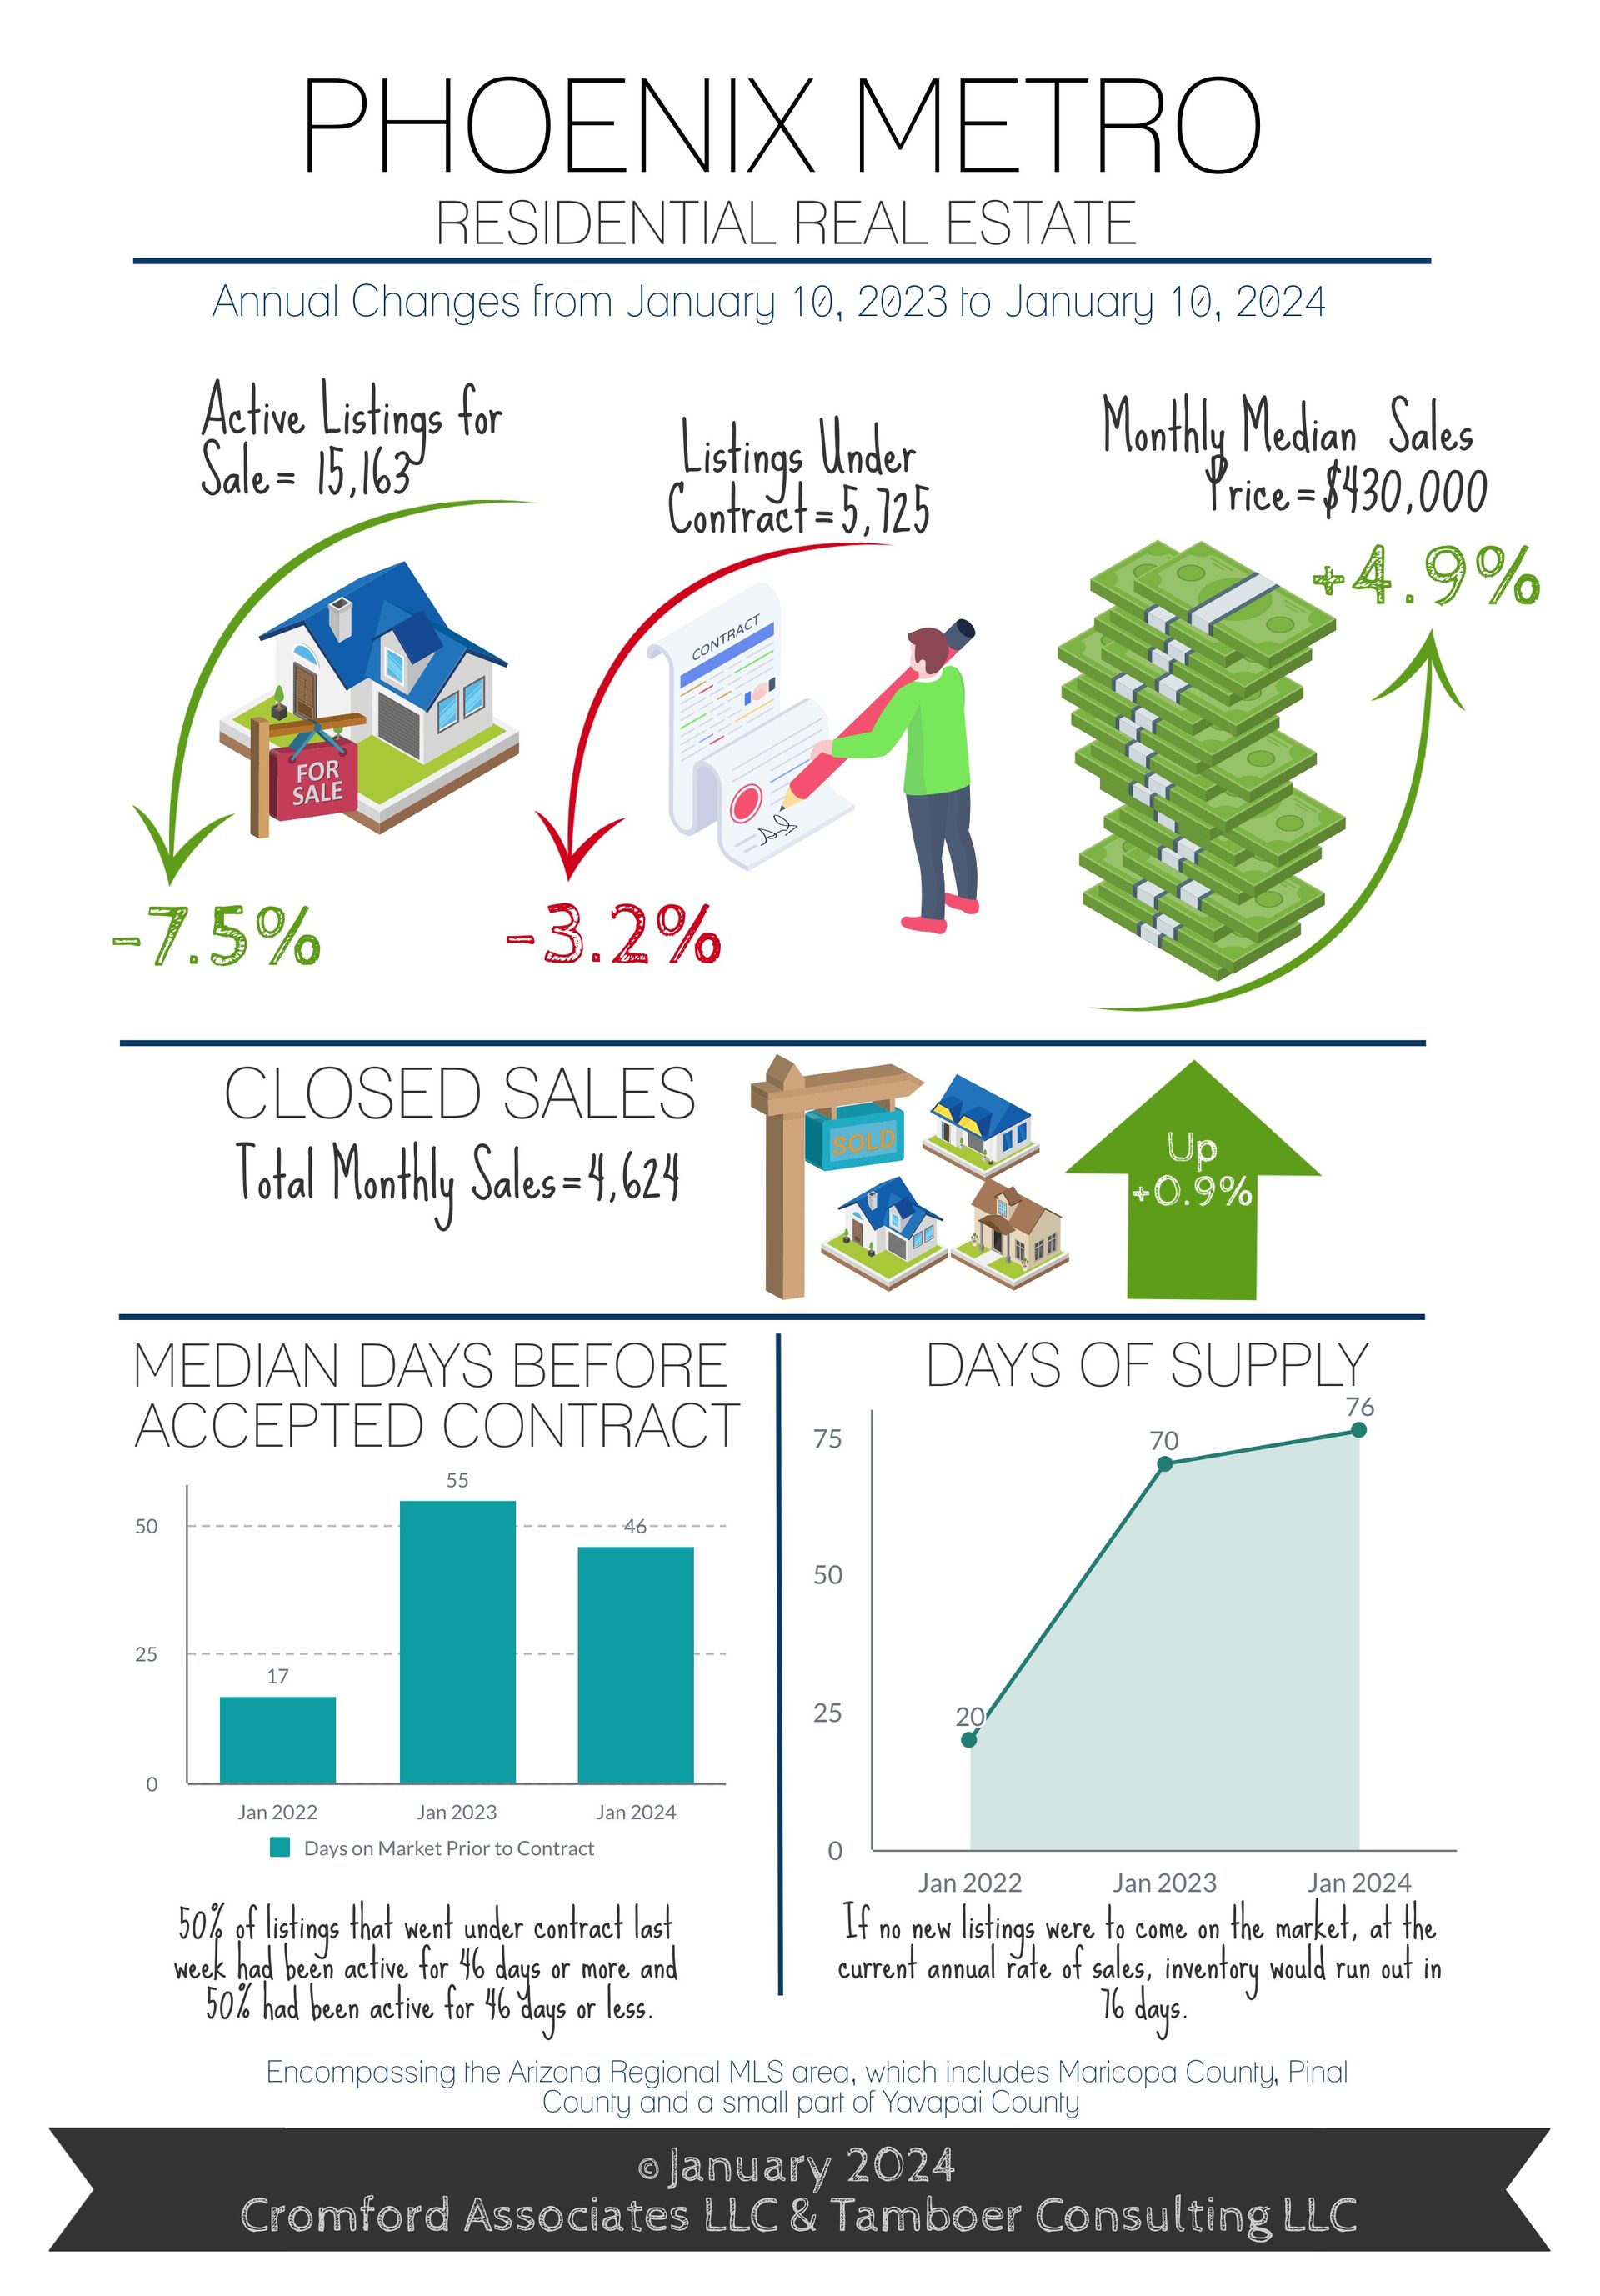
While Greater Phoenix is out of a balanced market and continually improving, the seller’s market is still very weak so a combination of good condition and price remains key to facilitating an offer within a reasonable time frame, along with an open mind regarding concessions to the buyer. New listings so far in the first week of January are higher than last year, but not high, and while inventory is beginning to rise moderately it’s still 37% below normal for this time of year.
Not all cities are in a seller’s market, the distribution is as follows from strongest-to-weakest:
Seller’s Markets:
- Tolleson,
- Apache Junction,
- Fountain Hills,
- Chandler,
- Gilbert, Laveen
- El Mirage
- Anthem
- Glendale
- Sun Lakes
- Phoenix
- Scottsdale
- Mesa
- Avondale
Balanced Markets:
- Tempe
- Litchfield Park
- Sun City West
- Peoria
- Goodyear
- Surprise
- Paradise Valley
- Arizona City
Buyer’s Markets:
- Cave Creek
- Gold Canyon
- Queen Creek
- Sun City
- Casa Grande
- Buckeye
- Maricopa
Most cities are either gradually improving or holding steady in their market measures. Sale price measures in January will reflect December negotiations, but with this turn in the market fueled by lower mortgage rates and seller concessions we can expect sales price measures to be sustained in the first quarter. The second quarter could get exciting if rates continue down.
*Talk to a qualified lender to determine your specific circumstance
Commentary written by Tina Tamboer, Senior Housing Analyst with The Cromford Report









