Is Metro Phoenix in a buyer's market or a seller's market?
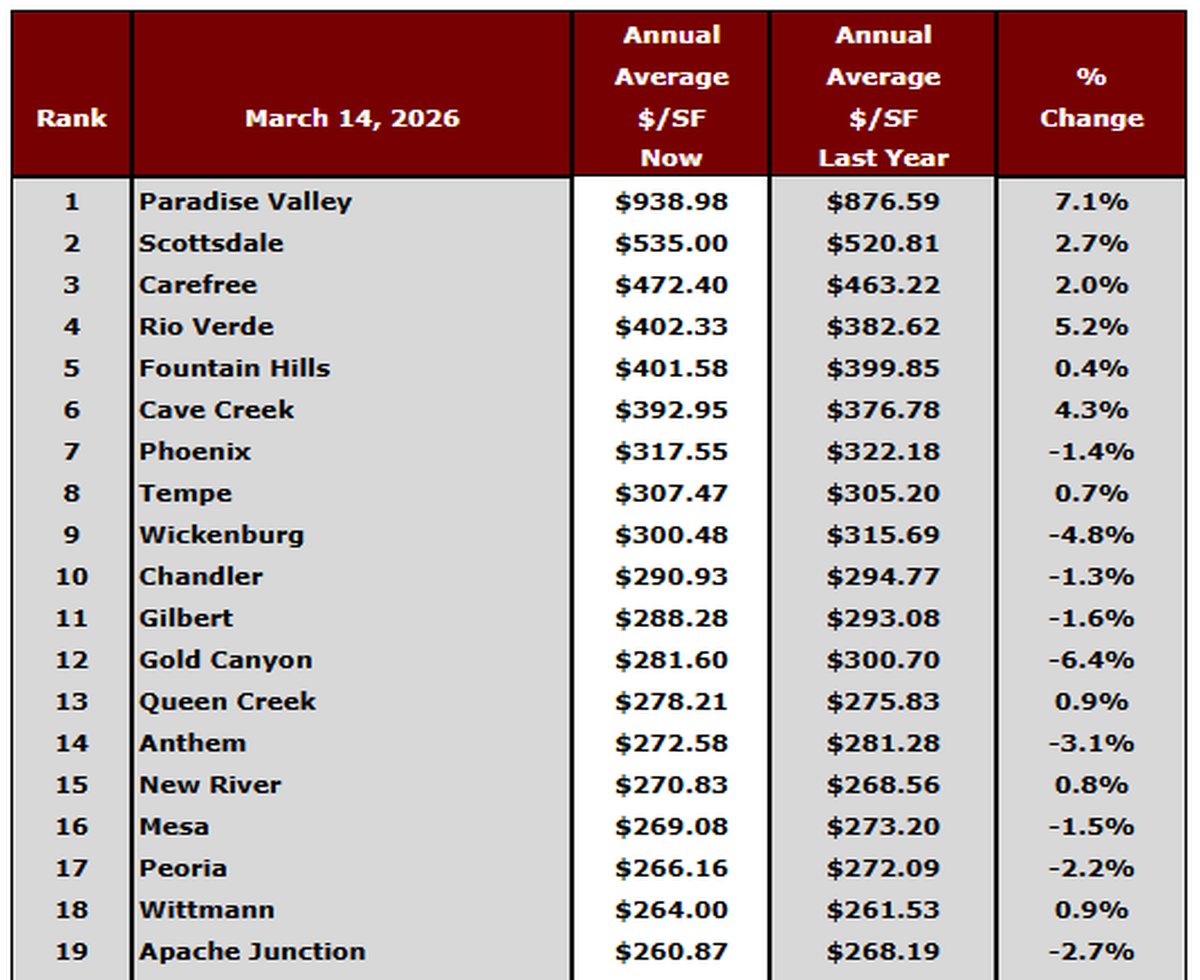
Cromford® Market Index for the single-family markets in our 17 largest cities
The Cromford Market Index is a complex algorithm that measures many supply and demand data points and outputs a number. 100 (+/- 10%) is a balanced market. Values over 110 favor sellers, and the higher the number the stronger the seller's market is. Values under 90 favor buyers, and the lower the number the stronger the buyer's market is.
This table is quite startling - the market balance is now swinging quickly towards sellers, yet this does not seem to be reflected in market commentary in the general media. This shows the advantage of measuring the housing market every day, rather than once a month. One month ago, the situation looked bleak for sellers. The average CMI has fallen by -4.3% in the month prior to December 1.
Today we see an average CMI improvement of +16.3%.
It is not just that supply has been falling rapidly, we are now seeing stronger demand. It being December, this may easily go unnoticed by those not paying close attention, but the numbers do not lie. Relative to November, December's demand numbers are improving. If this trend rolls over into January and continues, we could see a much more positive picture during the first quarter than we expect just 3 weeks ago.
The swing in favor of sellers is most noticeable in Paradise Valley, Avondale, Chandler, Tempe, Mesa, Glendale, Gilbert and Phoenix. Only Goodyear has yet to get with the program. Scottsdale is late to the party but is starting to swing over the last week.
We now have 5 cities in the seller's market zone over 110, 5 cities in the balanced zone between 90 and 110 and 7 in the buyer's market zone under 90.