
April 2025 Phoenix Arizona Real Estate Snapshot
Markets are a Mess, but it’s Business as Usual for Housing,
New Contracts Spike Between $250K-$500K
For Buyers:
It’s not easy to do predictions these days, even for just a month or two out. Home values typically don’t turn on a dime, so in order for a shift in supply or demand to have a lasting affect on home values it needs last for more than a few months. When a prediction is made regarding the housing market, it’s based on a level of expectation that current scenarios will continue. However, volatile trends in both the stock and bond markets have been changing by the hour due to abrupt and dramatic global trade negotiations, sending mortgage rates low and then high over the course of just a week. It’s like doing hard turns back and forth on the rudder of a large cargo ship, it’s a bumpy ride but there’s very little actual turning until the rudder commits to a position.
Fortunately, or unfortunately, volatility in the housing market is nothing new over the last 5 years. From extremely low mortgage rates, high demand, and astronomical appreciation from 2020-2021, to extremely high mortgage rates, falling demand, and depreciation in 2022, to moderately high mortgage rates, low-but-stable demand, and flat appreciation from 2023-2025. Real estate professionals have guided their clients through it all.
Emotions remain high in the news media headlines and consumer sentiment polls, but buyers continue to buy homes based on their personal needs, lifestyle, and financial situation. As of this writing, overall buyer demand in Greater Phoenix is holding steady, just about even with this time last year, with one unexpected spike in new contracts between $250K-$500K in late March. This coincided with a national 6% spike in FHA mortgage applications as qualified buyers took advantage of down-payment assistance and grant funds before regulations change regarding who may utilize them.
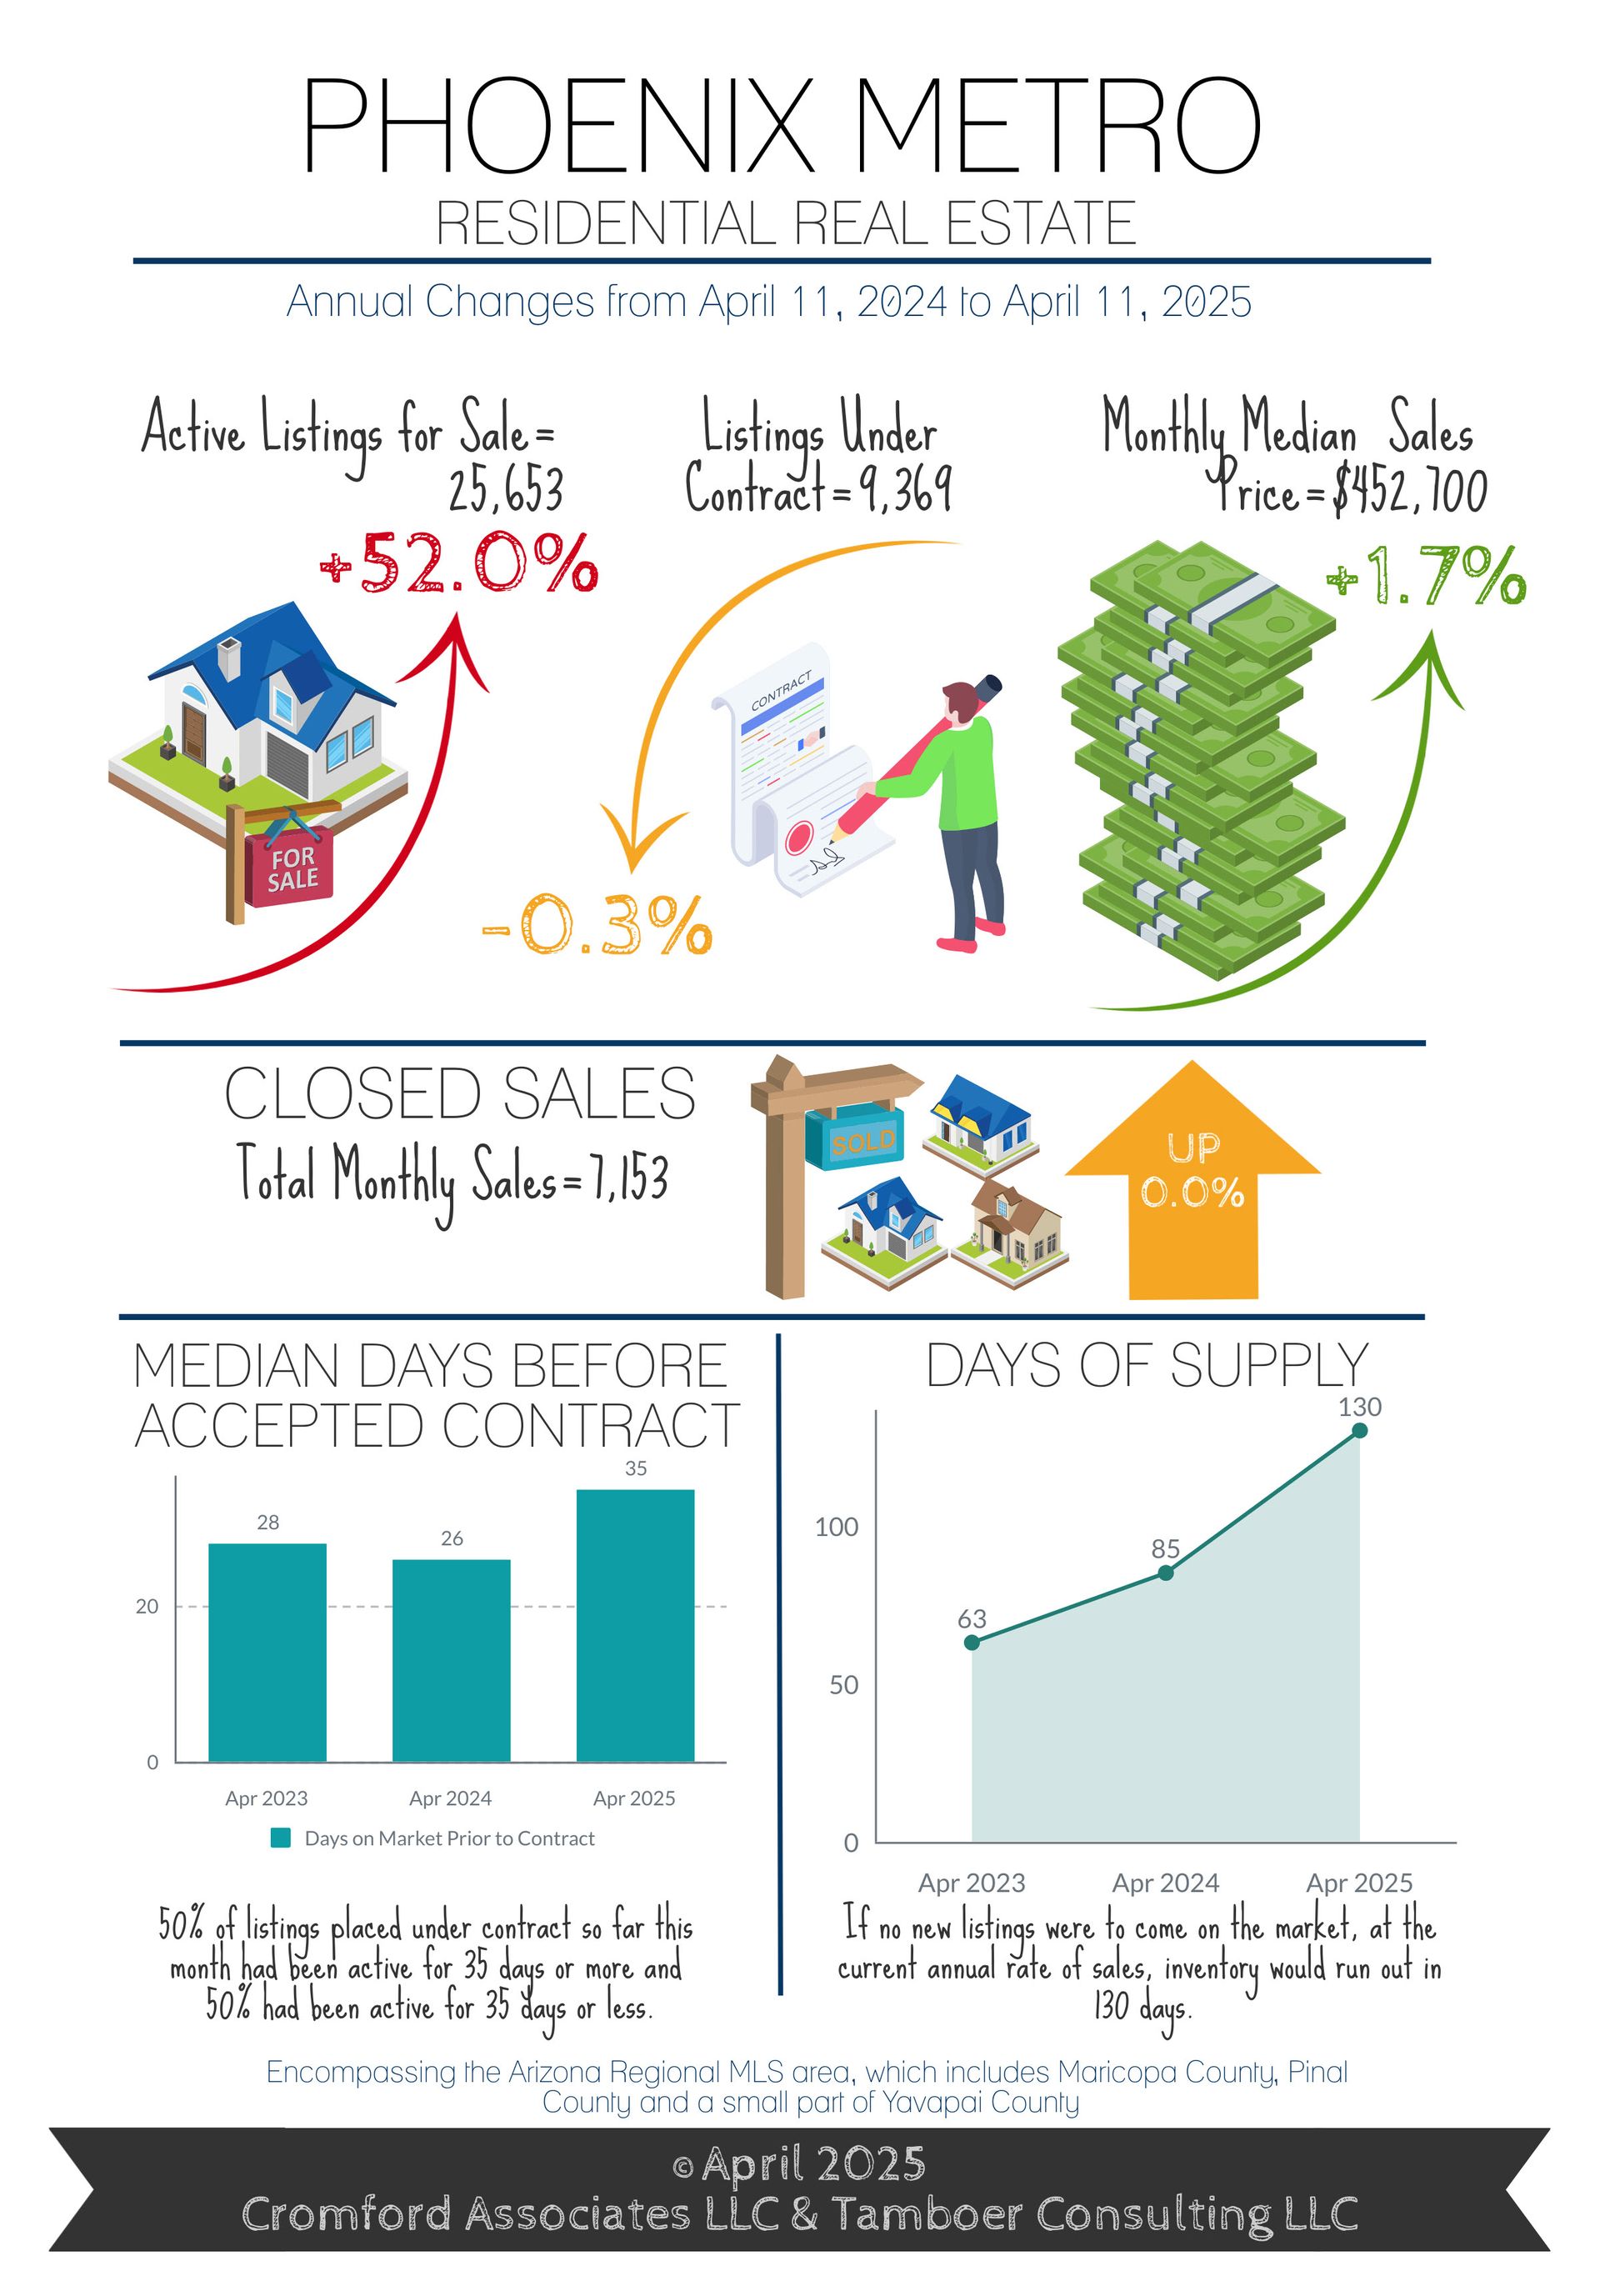
Supply continues to rise, putting buyers in good position during negotiations, and prices remain stable with the median up only 1.7% from last year. Negotiations are averaging 97.7% of the last list price, down from 97.8% April last year, but it varies by price range. Negotiations are still 99% of list on a $300K-$400K single family home, and 98.6% for $400K-$500K. On a home listed for $450,000, that’s a $6,300 negotiation to $443,700 on top of another $10,000 in median costs towards seller-paid closing costs.
For Sellers:
One segment of housing demand that does not care for the volatility in the markets is luxury buyers. Listings under contract over $1M has been drifting down for 6 weeks now as buyers take a pause to wait for some form of certainty to move forward. Despite this recent trend, contract activity still remains the 3rd best Greater Phoenix has ever seen, behind 2022 and 2024. Supply in this price range is also at record levels, which offsets the added demand and is keeping prices modest.
· 11 cities in Greater Phoenix are in very weak seller’s markets: Paradise Valley, Scottsdale, Fountain Hills, Phoenix, Anthem, El Mirage, Glendale, Avondale, Apache Junction, Chandler, Gilbert
· 4 cities are in balanced markets: Cave Creek, Tolleson, Tempe, Mesa
· 14 cities are in buyer’s markets: Peoria, Goodyear, Surprise, Buckeye, Laveen, Sun City, Sun City West, Litchfield Park, Queen Creek, Sun Lakes, Maricopa, Gold Canyon, Arizona City, Casa Grande
A weak seller’s market will not look too different from a balanced market, it only means that price appreciation will be slightly higher than the rate of inflation, which is just 2.4% per the most recent CPI measure. Sellers are always testing the top boundaries of price for a give, but in a buyer’s market they are routinely denied. This is reflected in the number of price reductions up 68% compared to last year at this time and at levels not seen since 2022. This is true even in seller’s markets of the Northeast Valley, with price reduction counts not seen since 2017. As a result, very few sellers are “greedy” in their asking prices as they are often lower or even with last year’s asking price per square foot. As with any buyer’s market, condition is a top priority for sellers along with pricing. In some cases that may be as simple as neutralizing kid’s room paint or accent walls, or as complicated as a new roof or major repairs prior to list.
Commentary written by Tina Tamboer, Senior Housing Analyst with The Cromford Report
©2025 Cromford Associates LLC and Tamboer Consulting LLC









