
April 2023 Phoenix Real Estate Snapshot
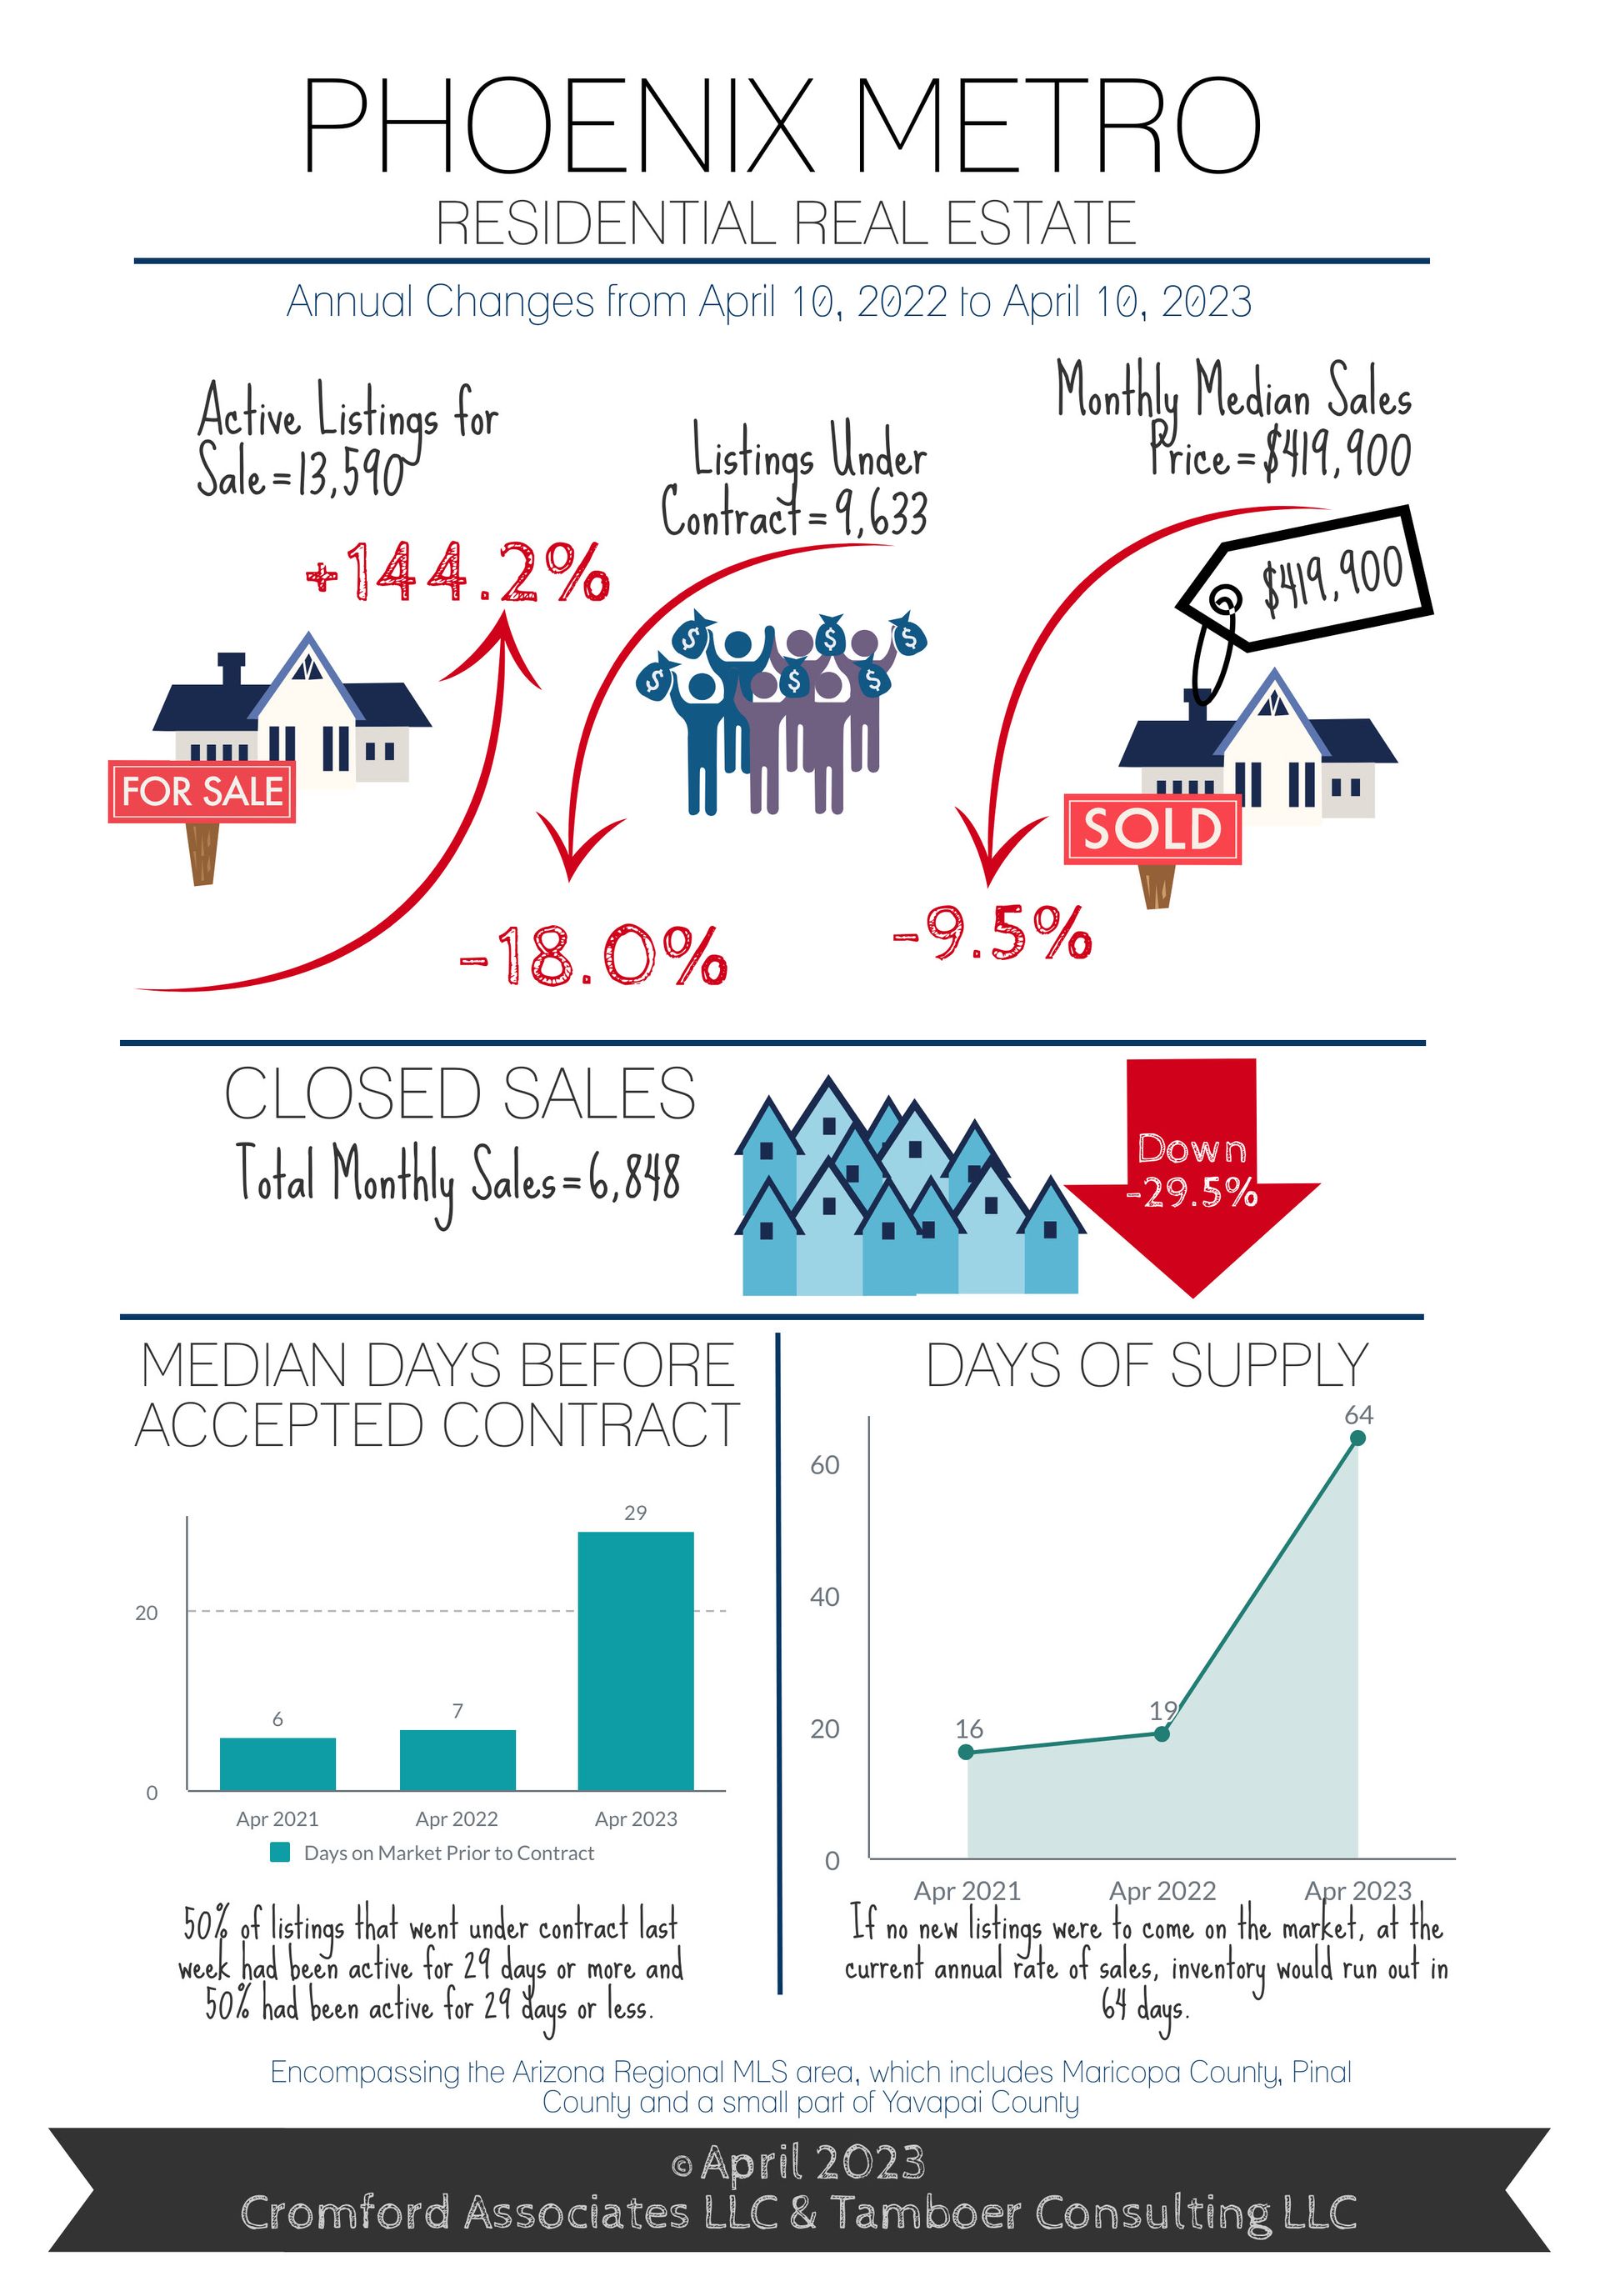
Supply Down 36% Since October, Dropping 54 Listings per Day in April,
Two More Cities in Seller’s Markets This Month, Prices Up 4 Months in a Row
For Buyers:
It’s been an eventful 4 weeks, again. Conventional rates dropped from their high of 7.1% on March 2nd to 6.1% by April 5th. Buyers entering the market in Phoenix today may be getting an unexpected shock if they’re looking for desperate sellers and rock bottom prices. Two more cities entered seller’s markets this month, Surprise and Goodyear. Now 14 out of the 17 biggest cities are favoring sellers and some zip codes in Chandler and the West Valley are on the market just 2-3 weeks prior to contract, down from 9-11 weeks.
January and February were months where skepticism dominated the marketplace. Skepticism happens
when leading indicators (reflecting future performance) are not in alignment with lagging indicators (reflecting past performance). Today, we are finally seeing the lagging indicators reflect what the leading indicators were telling us back in January. Sales price measures have now risen for 4 months straight and, while still down year-over-year for now, average sales price per square foot has recovered 5.7% since December. This is despite extreme mortgage rate volatility, two large bank failures, and another fed funds rate hike. You may ask yourself, “How can it be?”
Price trends do not depend on demand alone. Supply plays a major role, and it’s decreasing at an alarming rate. There are not enough new listings coming into the MLS to replace those that are going under contract. In fact, the MLS is seeing an average deficit of 54 listings per day since April 1st. While demand is considered 18% below normal for this time of year, supply is 40% below normal. Where is the relief going to come from? New single-family home permits dropped by 74% between March and December last year, so builders are not adding further to supply at the moment. iBuyer inventory from OpenDoor and OfferPad has dwindled from 12% of active supply last August to just 3-4% today, and it’s continuing to decline. Foreclosures are still at record low levels with little evidence to support a significant rise. In the short-term rental market, lower occupancy rates and looming regulations may spur some owners to sell their properties after the peak season is over, but it’s unclear if that supply will be enough to relieve the overall shortage of homes for sale.
At this time, leading indicators point to more upward pressure on price for Greater Phoenix. Time is of the essence for those buyers on the fence. As supply continues to decline, the percentage of sales with seller’s contributing to closing costs and mortgage rate buy-downs has declined as well, down from 52% in January to just 39% last week.
For Sellers:
Seller positions are improving, but the current environment is not remotely comparable to 2021 or 2022. Only 3 major cities remain in Buyer’s Markets. They are Queen Creek, Maricopa, and Buckeye. Queen Creek is a mild buyer’s market moving towards balance, and Maricopa is fast-improving as well. Price measures have stopped dropping in Maricopa and Buckeye, and San Tan Valley (Pinal side of Queen Creek). Greater Phoenix would not be in a seller’s market right now without hefty seller-paid incentives to buyers. Price points between $250K-$800K are showing 40-57% of sales involving seller-paid closing costs, and West Valley zip codes close to I-17 and Avondale are seeing 70-80% with similar concessions. The median cost to sellers is an additional $9,000, which is typically allocated to temporarily buying down a buyer’s mortgage rate by 2-3%. While sellers may lament buying down a rate on their sale, they may be awarded that same benefit when they turn into buyers, which certainly dulls the sting.
Demand is still weak due to wild fluctuations in mortgage rates. One can argue that the volatility in rates is worse than the rates themselves. A little stability will go a long way in improving demand, however for now it’s the lack of supply pushing prices up.
Commentary written by Tina Tamboer, Senior Housing Analyst with The Cromford Report
©2023 Cromford Associates LLC and Tamboer Consulting LLC









