
January 2022 Phoenix Real Estate Snapshot
Cost to Rent vs. Buy in 2022; Owner Occupant Buyers Retreated in 2021
For Buyers:
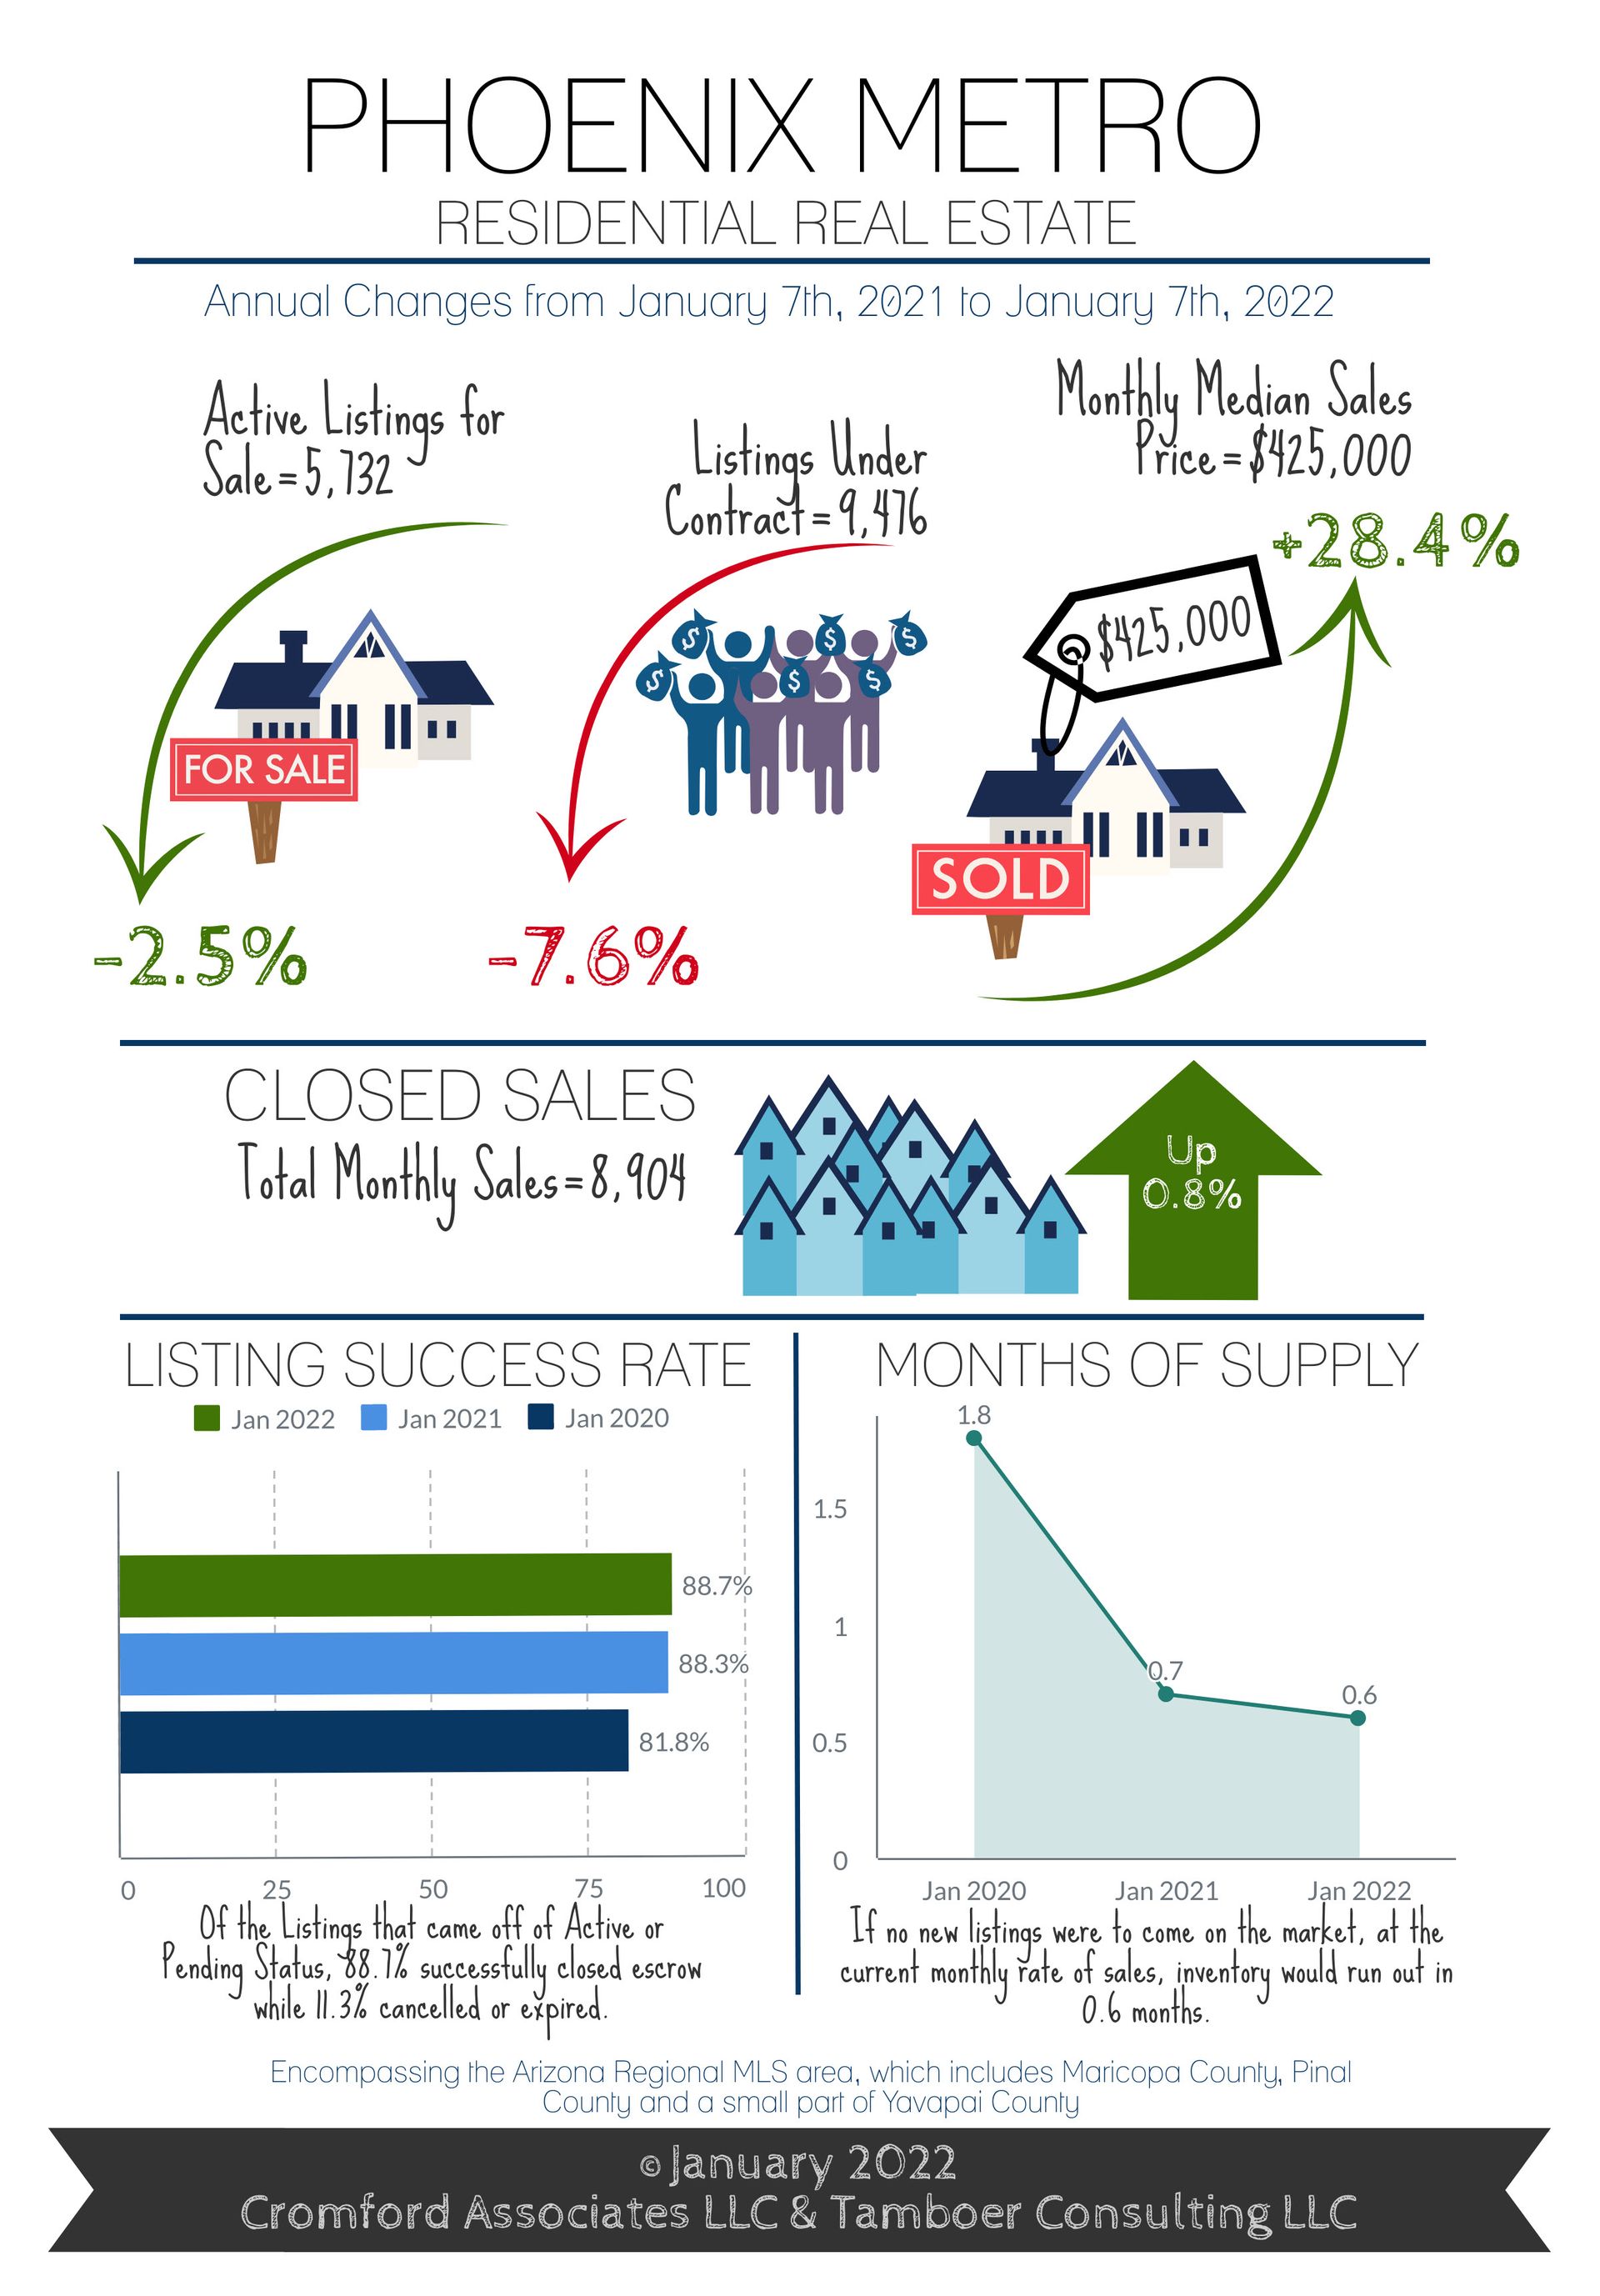
As the cost of purchasing a home increases in Greater Phoenix, the question of whether to rent or buy becomes harder to answer for some buyers. The overall median cost of a home is currently $425,000, and for a typical 1,500-2,000 square foot home, the median cost is $420,000. The estimated payment, assuming 10% down and including principal, interest, taxes and insurance, is $2,123. The median monthly rental rate for the same size range, recorded through the Arizona Regional MLS, was $2,195 in the 4th quarter of 2021; just $72 per month more.
Some buyers might question the advantage of purchasing a home in order to save $72 per month. However, the financial advantage of owning vs. renting is typically realized for those who own their home for at least 3-5 years.
Let’s assume, hypothetically, that a buyer purchased a home today for $420,000 with a $42,000 down payment (10%). Over the next 5 years, their home’s value fluctuates up and down and in the end doesn’t appreciate. That may sound horrifying, however during this time the loan principle has been paid down to $336,000. The homeowner’s equity has doubled from $42,000 to $84,000 without their home appreciating a dime, and with 20% equity they no longer have to pay private mortgage insurance. Their payment declines $200. Still a win.
Now let’s assume, hypothetically again, that while our homeowner is paying down their loan, the home value fluctuates up, down and sideways, but still averages a 6% appreciation rate over 5 years (close to the current rate of inflation). The home would be then be worth $562,000, an increase of $142,000.
After 5 years, this hypothetical homeowner went from $42,000 to $226,000 in equity, and their monthly cost was nearly the same as what they would have paid in rent anyway. For this reason, even when the monthly payment required to buy is close to that to rent, buying still wins in the long game.
For Sellers:
Despite rumors of the U.S. housing market cooling off, Greater Phoenix has moved farther into a seller’s market over the past month. Growing disparity between supply and demand in our market means there is little evidence to suggest price appreciation will slow in the first quarter. After a strong summer, new listings slowed down in the 4th quarter of 2021, while the number of accepted contracts remained high. The result is 2022 starting off with another historically low supply level, and listings under contract, while 7.6% below 2021, still strong with the 2nd highest count since 2014.
It’s an accepted opinion among local analysts that income levels in Greater Phoenix cannot sustain another year of 28% annual appreciation, especially if interest rates continue to increase. However, seeing there is little relief from home builders adding more supply to the equation, it’s reasonable to expect the market to respond with a softening of demand. This trend started to reveal itself in the 2nd Quarter of 2021 in a subtle manner.
Since 2014, buyers purchasing their primary residence have made up 70%-76% of total residential purchases in Maricopa and Pinal County. In Q2 2021, that percentage dipped to 67%, and declined to 63% by October. While traditional buyers retreated, competing buyers for 2nd homes and institutional buyers made up of Wall Street-backed iBuyers, hedge funds and other investment groups stepped in. Price appreciation slowed from an average of 3.3% per month to 1.1%.
While 2022 is coming out of the gate strong, and the Spring is typically the strongest season for buyers, it remains to be seen how much control investors and 2nd home buyers will take if traditional home buyers retreat. The last time they ignored affordability issues within the community, everyone lost in the end.
Commentary written by Tina Tamboer, Senior Housing Analyst with The Cromford Report
©2022 Cromford Associates LLC and Tamboer Consulting LLC









